
- Start >
- Rivers >
- Discharge >
- Iller - Lech - Bodensee >
- Lechbruck >
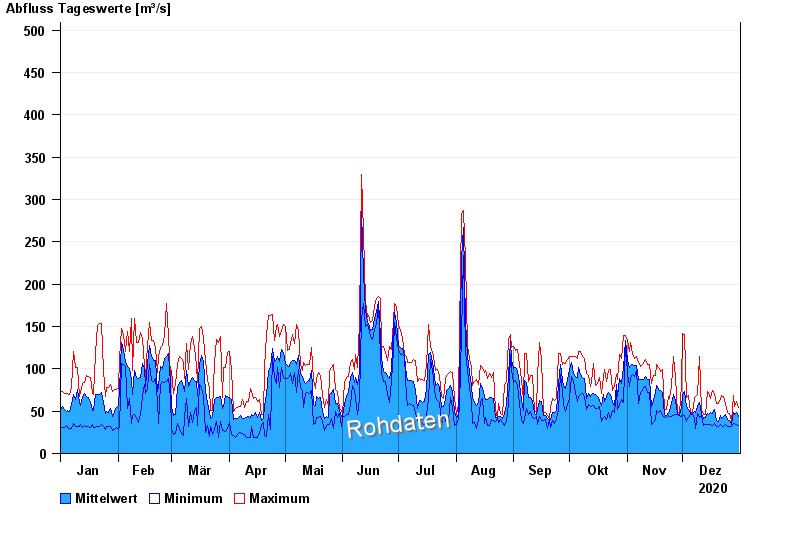
- Chart of year

Chart of year Lechbruck / Lech
Discharge from 01.01.2020 to 31.12.2020
note
Messwerte beeinflusst durch Kraftwerkssteuerungen.
- 10.08.1970 Abfluss: 971 m³/s
- 22.05.1999 Abfluss: 855 m³/s
- 23.08.2005 Abfluss: 836 m³/s
- 13.05.1999 Abfluss: 700 m³/s
- 23.07.1966 Abfluss: 640 m³/s
| Date | Mean value [m³/s] | Maximum [m³/s] | Minimum [m³/s] |
|---|---|---|---|
| 31.12.2020 | 44.2 | 53.9 | 32.7 |
| 30.12.2020 | 48.1 | 61.3 | 34.4 |
| 29.12.2020 | 45.9 | 55.7 | 34.9 |
| 28.12.2020 | 48 | 68.5 | 34.9 |
| 27.12.2020 | 34.6 | 37.3 | 31.6 |
| 26.12.2020 | 39.3 | 47.4 | 31.6 |
| 25.12.2020 | 39.8 | 48.1 | 32.1 |
© Bayerisches Landesamt für Umwelt 2024