
- Start >
- Rivers >
- Discharge >
- Iller - Lech - Bodensee >
- Lechbruck >
- Chart of year

Chart of year Lechbruck / Lech
Discharge from 20.04.2024 to 19.04.2025
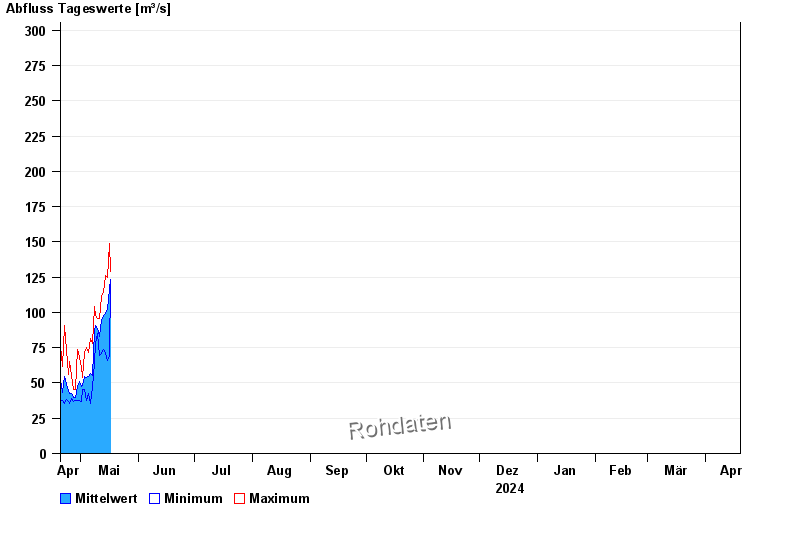
note
Messwerte beeinflusst durch Kraftwerkssteuerungen.
- HQ10 390 m³/s
- HQ100 800 m³/s
| Date | Mean value [m³/s] | Maximum [m³/s] | Minimum [m³/s] |
|---|---|---|---|
| 02.05.2024 | 53 | 54 | 47 |
| 01.05.2024 | 47.6 | 60.9 | 37.1 |
| 30.04.2024 | 50.8 | 68.3 | 37.8 |
| 29.04.2024 | 47.8 | 74 | 37.8 |
| 28.04.2024 | 39.6 | 45.3 | 37.8 |
| 27.04.2024 | 40 | 45.3 | 37.1 |
| 26.04.2024 | 42.5 | 55 | 39.2 |
© Bayerisches Landesamt für Umwelt 2024