
- Start >
- Rivers >
- Discharge >
- Iller - Lech - Bodensee >
- Lauben >
- Chart of year

Chart of year Lauben / Günz
Discharge from 18.05.2022 to 17.05.2023
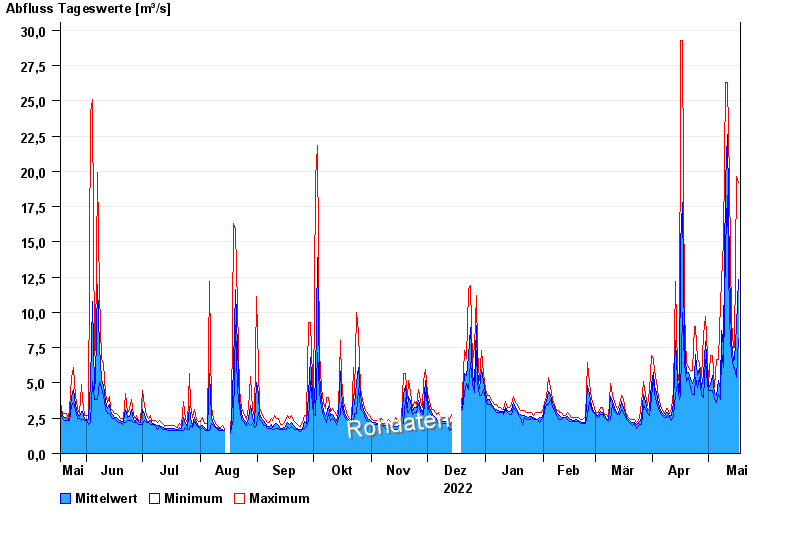
| Date | Mean value [m³/s] | Maximum [m³/s] | Minimum [m³/s] |
|---|---|---|---|
| 17.05.2023 | 12.3 | 19.2 | 8.12 |
| 16.05.2023 | 9.1 | 19.6 | 5.36 |
| 15.05.2023 | 6.66 | 7.51 | 6.12 |
| 14.05.2023 | 6.62 | 7.51 | 6.12 |
| 13.05.2023 | 7.94 | 9.36 | 6.94 |
| 12.05.2023 | 13 | 19.2 | 9.36 |
| 11.05.2023 | 22.6 | 26.3 | 18.3 |
© Bayerisches Landesamt für Umwelt 2024