
- Start >
- Rivers >
- Discharge >
- Iller - Lech - Bodensee >
- Lauben >
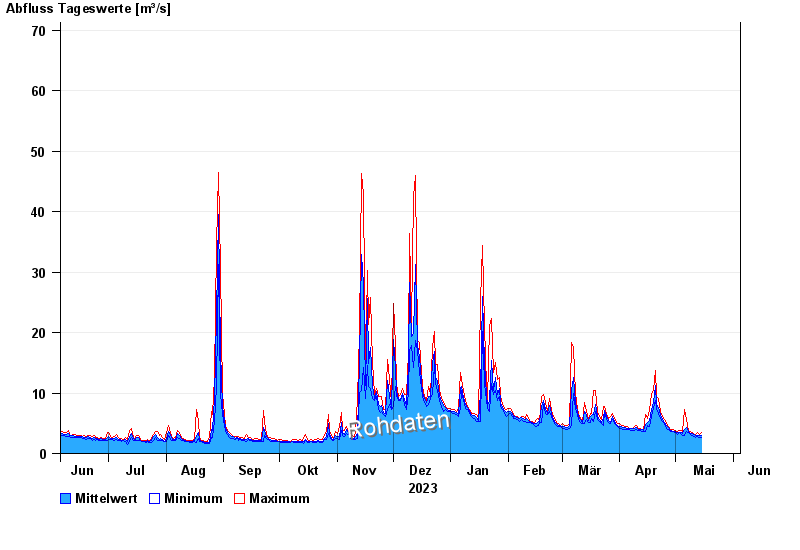
- Chart of year

Chart of year Lauben / Günz
Discharge from 05.06.2023 to 04.06.2024
- 31.05.1940 Abfluss: 90,8 m³/s
- 12.08.2002 Abfluss: 85,2 m³/s
- 18.06.1991 Abfluss: 83,4 m³/s
- 23.08.2005 Abfluss: 76,8 m³/s
- 13.04.1994 Abfluss: 74 m³/s
| Date | Mean value [m³/s] | Maximum [m³/s] | Minimum [m³/s] |
|---|---|---|---|
| 29.04.2024 | 3.81 | 4 | 3.6 |
| 28.04.2024 | 4.01 | 4.21 | 3.8 |
| 27.04.2024 | 4.23 | 4.43 | 4 |
| 26.04.2024 | 4.66 | 4.89 | 4.21 |
| 25.04.2024 | 5.15 | 5.61 | 4.89 |
| 24.04.2024 | 5.64 | 6.12 | 5.36 |
| 23.04.2024 | 6.3 | 6.94 | 5.87 |
© Bayerisches Landesamt für Umwelt 2024