
- Start >
- Rivers >
- Discharge >
- Iller - Lech - Bodensee >
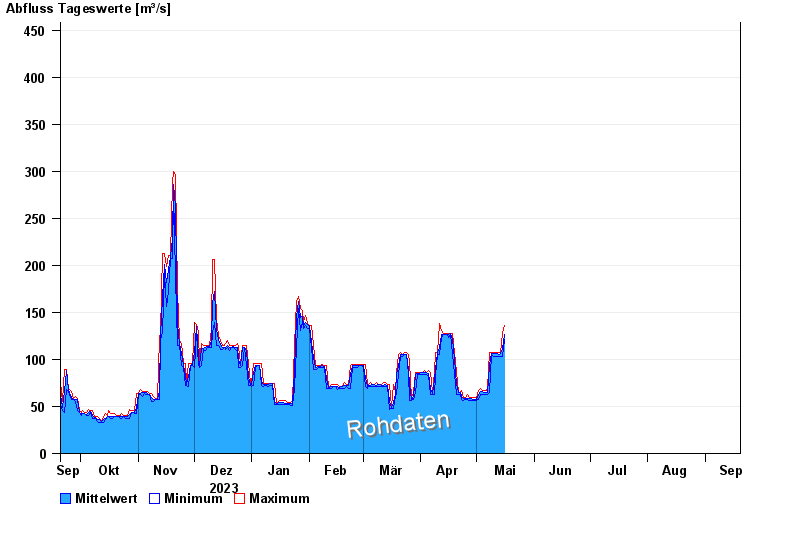
- Landsberg >
- Chart of year

Chart of year Landsberg / Lech
Discharge from 20.09.2023 to 19.09.2024
note
Messwerte beeinflusst durch Kraftwerkssteuerungen.
- 10.08.1970 Abfluss: 1170 m³/s
- 22.05.1999 Abfluss: 1100 m³/s
- 23.08.2005 Abfluss: 987 m³/s
- 13.05.1999 Abfluss: 830 m³/s
- 24.07.1966 Abfluss: 712 m³/s
| Date | Mean value [m³/s] | Maximum [m³/s] | Minimum [m³/s] |
|---|---|---|---|
| 15.05.2024 | 111 | 128 | 103 |
| 14.05.2024 | 106 | 107 | 103 |
| 13.05.2024 | 105 | 107 | 103 |
| 12.05.2024 | 106 | 107 | 103 |
| 11.05.2024 | 106 | 107 | 103 |
| 10.05.2024 | 106 | 107 | 103 |
| 09.05.2024 | 106 | 107 | 105 |
© Bayerisches Landesamt für Umwelt 2024