
- Start >
- Rivers >
- Discharge >
- Iller - Lech - Bodensee >
- Landsberg >
- Chart of year

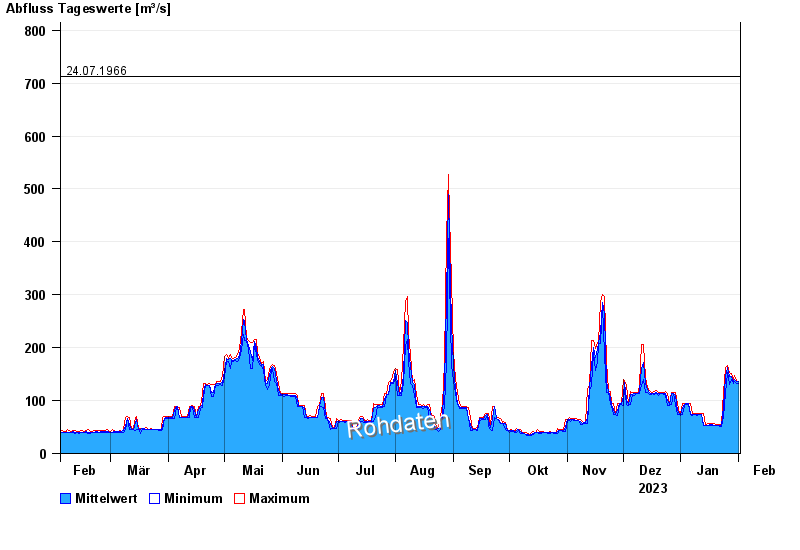
Chart of year Landsberg / Lech
Discharge from 02.02.2023 to 01.02.2024
note
Messwerte beeinflusst durch Kraftwerkssteuerungen.
- 10.08.1970 Abfluss: 1170 m³/s
- 22.05.1999 Abfluss: 1100 m³/s
- 23.08.2005 Abfluss: 987 m³/s
- 13.05.1999 Abfluss: 830 m³/s
- 24.07.1966 Abfluss: 712 m³/s
| Date | Mean value [m³/s] | Maximum [m³/s] | Minimum [m³/s] |
|---|---|---|---|
| 01.02.2024 | 136 | 136 | 133 |
| 31.01.2024 | 137 | 138 | 133 |
| 30.01.2024 | 139 | 147 | 136 |
| 29.01.2024 | 136 | 140 | 133 |
| 28.01.2024 | 146 | 152 | 140 |
| 27.01.2024 | 145 | 154 | 131 |
| 26.01.2024 | 162 | 167 | 154 |
© Bayerisches Landesamt für Umwelt 2024