
- Start >
- Rivers >
- Discharge >
- Iller - Lech - Bodensee >
- Landsberg >
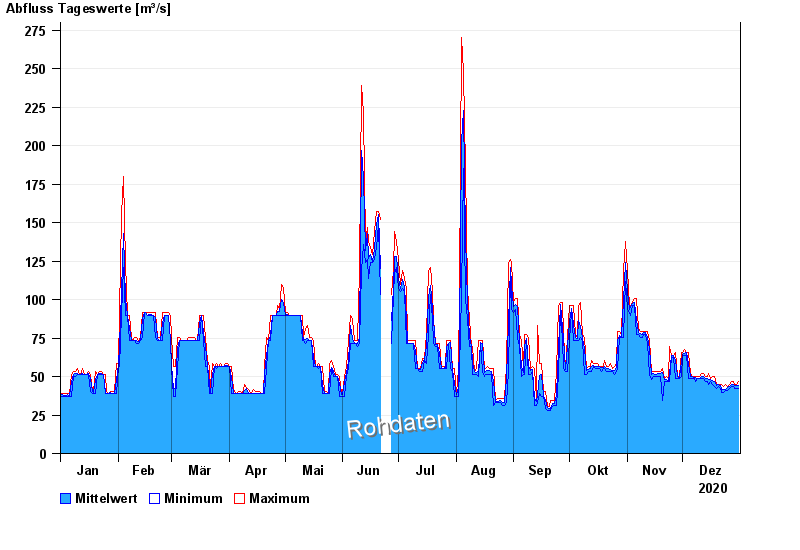
- Chart of year

Chart of year Landsberg / Lech
Discharge from 01.01.2020 to 31.12.2020
note
Messwerte beeinflusst durch Kraftwerkssteuerung.
| Date | Mean value [m³/s] | Maximum [m³/s] | Minimum [m³/s] |
|---|---|---|---|
| 31.12.2020 | 44.3 | 46.8 | 42.4 |
| 30.12.2020 | 44.4 | 45.1 | 42.4 |
| 29.12.2020 | 44.4 | 45.1 | 42.4 |
| 28.12.2020 | 44.8 | 46.8 | 43.7 |
| 27.12.2020 | 44.7 | 46.8 | 43.7 |
| 26.12.2020 | 43.8 | 45.1 | 42.4 |
| 25.12.2020 | 42.8 | 43.7 | 41 |
© Bayerisches Landesamt für Umwelt 2025