
- Start >
- Rivers >
- Discharge >
- Iller - Lech - Bodensee >
- Landsberg >
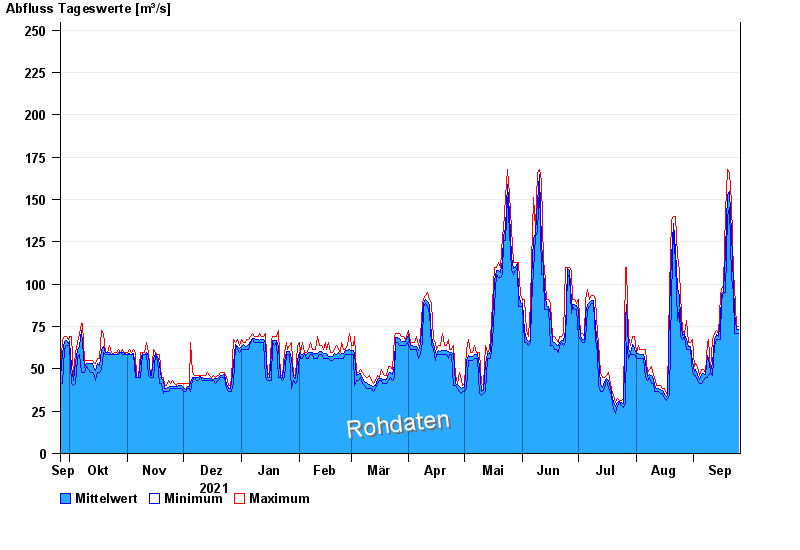
- Chart of year

Chart of year Landsberg / Lech
Discharge from 26.09.2021 to 25.09.2022
note
Messwerte beeinflusst durch Kraftwerkssteuerungen.
- 10.08.1970 Abfluss: 1170 m³/s
- 22.05.1999 Abfluss: 1100 m³/s
- 23.08.2005 Abfluss: 987 m³/s
- 13.05.1999 Abfluss: 830 m³/s
- 24.07.1966 Abfluss: 712 m³/s
| Date | Mean value [m³/s] | Maximum [m³/s] | Minimum [m³/s] |
|---|---|---|---|
| 25.09.2022 | 73 | 74.9 | 71 |
| 24.09.2022 | 73 | 74.9 | 71 |
| 23.09.2022 | 83.4 | 99.1 | 71 |
| 22.09.2022 | 99.6 | 106 | 95.1 |
| 21.09.2022 | 130 | 148 | 104 |
| 20.09.2022 | 155 | 166 | 145 |
| 19.09.2022 | 153 | 168 | 140 |
© Bayerisches Landesamt für Umwelt 2024