
- Start >
- Rivers >
- Discharge >
- Iller - Lech - Bodensee >
- Landsberg >
- Chart of year

Chart of year Landsberg / Lech
Discharge from 20.09.2018 to 19.09.2019
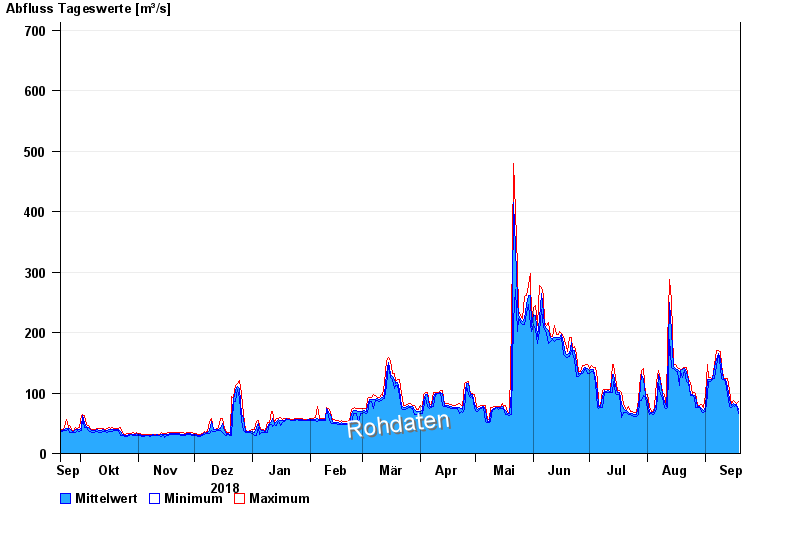
note
Messwerte beeinflusst durch Kraftwerkssteuerungen.
- 10.08.1970 Abfluss: 1170 m³/s
- 22.05.1999 Abfluss: 1100 m³/s
- 23.08.2005 Abfluss: 987 m³/s
- 13.05.1999 Abfluss: 830 m³/s
- 24.07.1966 Abfluss: 712 m³/s
| Date | Mean value [m³/s] | Maximum [m³/s] | Minimum [m³/s] |
|---|---|---|---|
| 19.09.2019 | 73.4 | 85.2 | 66.4 |
| 18.09.2019 | 80.9 | 83.3 | 79.5 |
| 17.09.2019 | 81 | 85.2 | 77.6 |
| 16.09.2019 | 83.2 | 87 | 79.5 |
| 15.09.2019 | 80 | 81.4 | 75.7 |
| 14.09.2019 | 88.9 | 104 | 77.6 |
| 13.09.2019 | 109 | 124 | 97.2 |
© Bayerisches Landesamt für Umwelt 2024