
- Start >
- Rivers >
- Discharge >
- Iller - Lech - Bodensee >
- Kempten >
- Chart of year

Chart of year Kempten / Iller
Discharge from 01.01.2023 to 31.12.2023
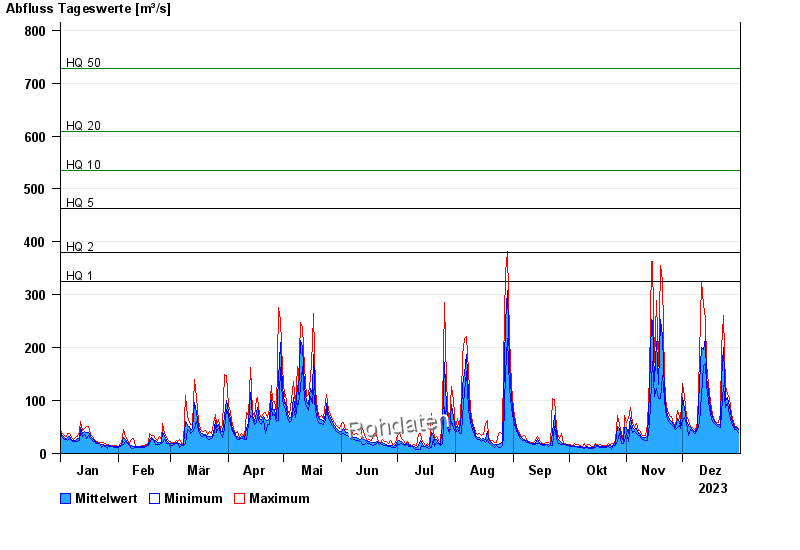
- HQ1 326 m³/s
- HQ2 379 m³/s
- HQ5 463 m³/s
- HQ10 534 m³/s
- HQ20 609 m³/s
- HQ50 728 m³/s
- HQ100 829 m³/s
| Date | Mean value [m³/s] | Maximum [m³/s] | Minimum [m³/s] |
|---|---|---|---|
| 31.12.2023 | 45 | 47.8 | 40.4 |
| 30.12.2023 | 48.4 | 50.3 | 46 |
| 29.12.2023 | 49.5 | 53 | 46 |
| 28.12.2023 | 54.2 | 60.4 | 50.3 |
| 27.12.2023 | 66.5 | 74.5 | 57.6 |
| 26.12.2023 | 88.2 | 106 | 74.5 |
| 25.12.2023 | 106 | 111 | 94.9 |
© Bayerisches Landesamt für Umwelt 2024