
- Start >
- Rivers >
- Discharge >
- Iller - Lech - Bodensee >
- Hasberg >
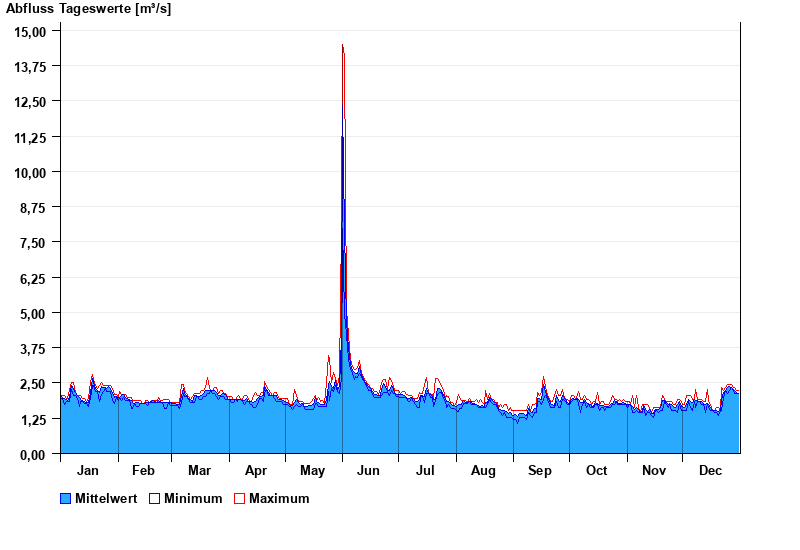
- Chart of year

Chart of year Hasberg / Östliche Mindel
Discharge from 01.01.2024 to 31.12.2024
| Date | Mean value [m³/s] | Maximum [m³/s] | Minimum [m³/s] |
|---|---|---|---|
| 14.06.2024 | 2 | 2.05 | 1.94 |
| 13.06.2024 | 2.1 | 2.16 | 2.05 |
| 12.06.2024 | 2.19 | 2.27 | 2.16 |
| 11.06.2024 | 2.35 | 2.38 | 2.27 |
| 10.06.2024 | 2.64 | 2.85 | 2.38 |
| 09.06.2024 | 2.37 | 2.61 | 2.27 |
| 08.06.2024 | 2.37 | 2.49 | 2.27 |
© Bayerisches Landesamt für Umwelt 2024