
- Start >
- Rivers >
- Discharge >
- Iller - Lech - Bodensee >
- Gunzesried >
- Chart of year

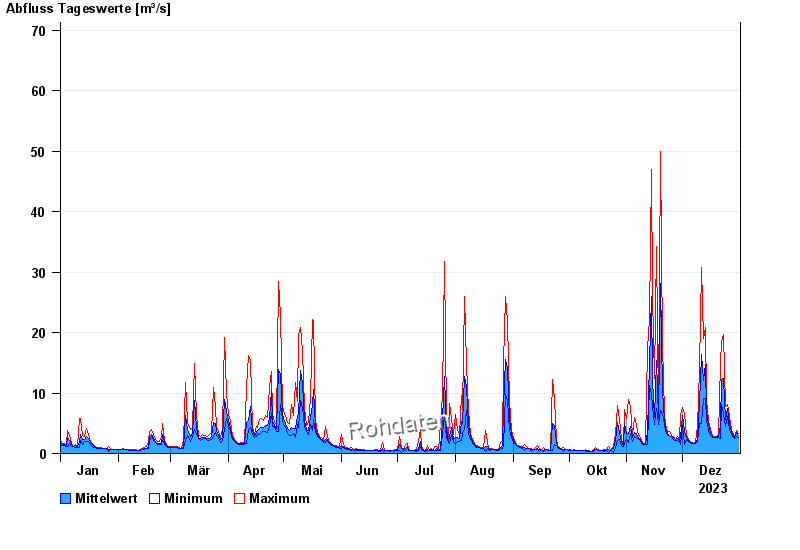
Chart of year Gunzesried / Gunzesrieder Ach
Discharge from 01.01.2023 to 31.12.2023
- 22.08.2005 Abfluss: 195 m³/s
- 22.05.1999 Abfluss: 122 m³/s
- 12.06.2000 Abfluss: 110 m³/s
- 15.02.1990 Abfluss: 110 m³/s
- 25.08.2002 Abfluss: 106 m³/s
| Date | Mean value [m³/s] | Maximum [m³/s] | Minimum [m³/s] |
|---|---|---|---|
| 31.12.2023 | 2.93 | 3.28 | 2.66 |
| 30.12.2023 | 3.48 | 3.79 | 2.81 |
| 29.12.2023 | 2.69 | 2.81 | 2.51 |
| 28.12.2023 | 2.82 | 3.12 | 2.66 |
| 27.12.2023 | 3.43 | 3.96 | 3.12 |
| 26.12.2023 | 4.88 | 6.13 | 3.96 |
| 25.12.2023 | 7.45 | 8.18 | 6.13 |
© Bayerisches Landesamt für Umwelt 2024