
- Start >
- Rivers >
- Discharge >
- Iller - Lech - Bodensee >
- Gunzesried >
- Chart of year

Chart of year Gunzesried / Gunzesrieder Ach
Discharge from 29.03.2024 to 28.03.2025
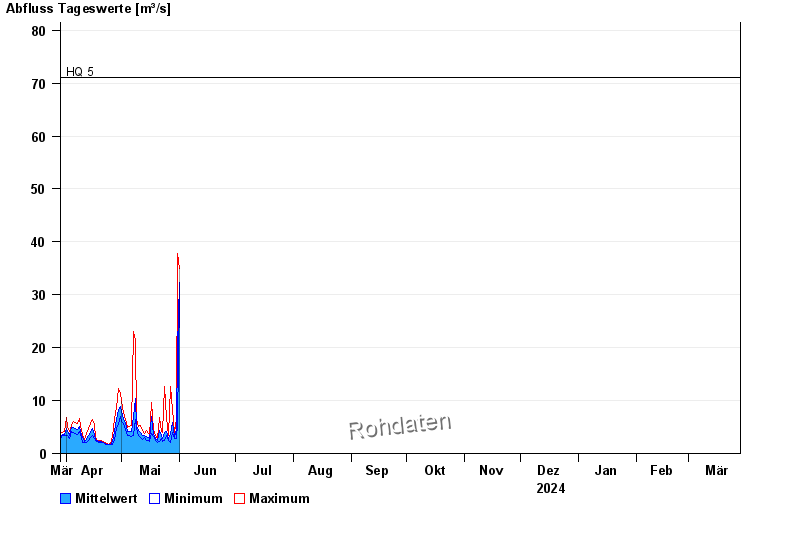
- HQ5 71 m³/s
- HQ10 87 m³/s
- HQ20 105 m³/s
- HQ50 135 m³/s
- HQ100 160 m³/s
| Date | Mean value [m³/s] | Maximum [m³/s] | Minimum [m³/s] |
|---|---|---|---|
| 05.06.2024 | 4.91 | 5.32 | 4.54 |
| 04.06.2024 | 7.5 | 10.9 | 5.32 |
| 03.06.2024 | 14.8 | 25.4 | 6.36 |
| 02.06.2024 | 8.15 | 12.2 | 5.94 |
| 01.06.2024 | 22 | 35 | 12.2 |
| 31.05.2024 | 20 | 37.8 | 5.52 |
| 30.05.2024 | 4.63 | 6.58 | 2.85 |
© Bayerisches Landesamt für Umwelt 2024