
- Start >
- Rivers >
- Discharge >
- Iller - Lech - Bodensee >
- Gschwend >
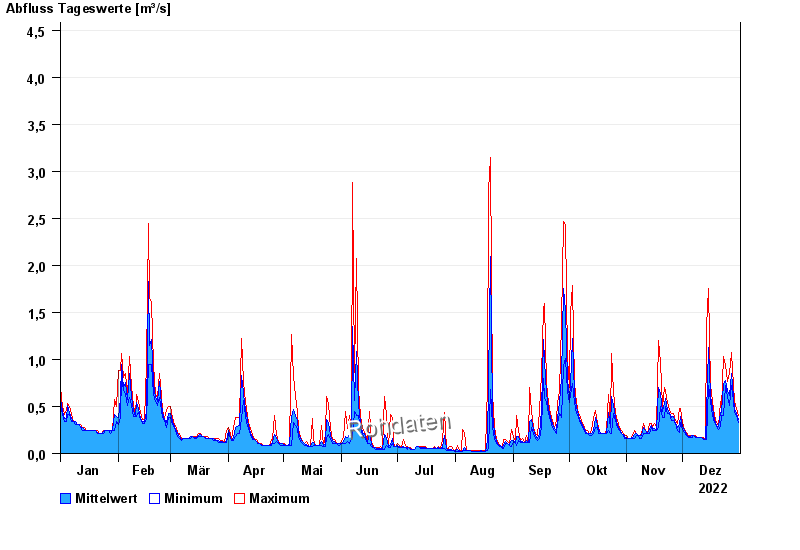
- Chart of year

Chart of year Gschwend / Rottach
Discharge from 01.01.2022 to 31.12.2022
- 23.08.2005 Abfluss: 16,2 m³/s
- 12.08.2002 Abfluss: 15 m³/s
- 02.06.2013 Abfluss: 13,4 m³/s
- 18.07.1997 Abfluss: 10,6 m³/s
- 21.09.2000 Abfluss: 10,4 m³/s
| Date | Mean value [m³/s] | Maximum [m³/s] | Minimum [m³/s] |
|---|---|---|---|
| 31.12.2022 | 0.362 | 0.399 | 0.326 |
| 30.12.2022 | 0.429 | 0.475 | 0.399 |
| 29.12.2022 | 0.48 | 0.553 | 0.436 |
| 28.12.2022 | 0.598 | 0.718 | 0.553 |
| 27.12.2022 | 0.848 | 1.07 | 0.718 |
| 26.12.2022 | 0.614 | 0.85 | 0.513 |
| 25.12.2022 | 0.675 | 0.761 | 0.594 |
© Bayerisches Landesamt für Umwelt 2024