
- Start >
- Rivers >
- Discharge >
- Iller - Lech - Bodensee >
- Gschwend >
- Chart of year

Chart of year Gschwend / Rottach
Discharge from 13.12.2019 to 12.12.2020
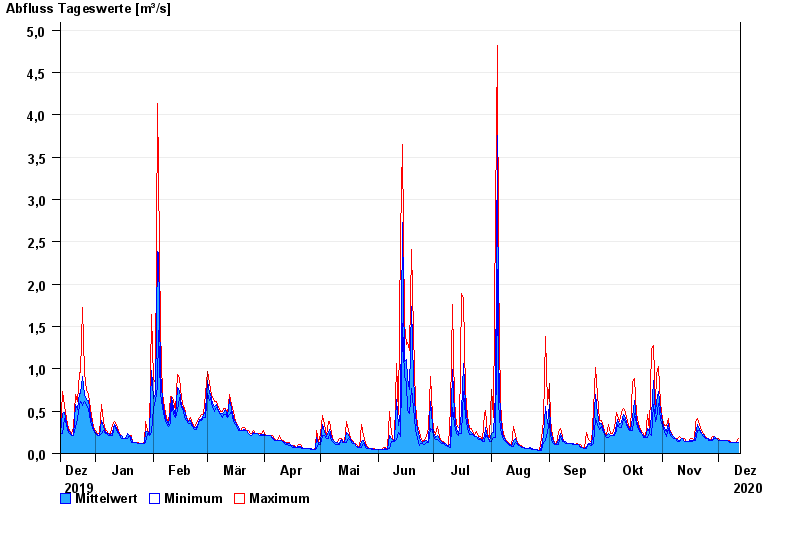
| Date | Mean value [m³/s] | Maximum [m³/s] | Minimum [m³/s] |
|---|---|---|---|
| 12.12.2020 | 0.135 | 0.176 | 0.126 |
| 11.12.2020 | 0.126 | 0.126 | 0.126 |
| 10.12.2020 | 0.126 | 0.126 | 0.126 |
| 09.12.2020 | 0.126 | 0.126 | 0.126 |
| 08.12.2020 | 0.126 | 0.126 | 0.126 |
| 07.12.2020 | 0.136 | 0.148 | 0.126 |
| 06.12.2020 | 0.148 | 0.148 | 0.148 |
© Bayerisches Landesamt für Umwelt 2024