
- Start >
- Rivers >
- Discharge >
- Iller - Lech - Bodensee >
- Gschwend >
- Chart of year

Chart of year Gschwend / Rottach
Discharge from 01.01.2023 to 31.12.2023
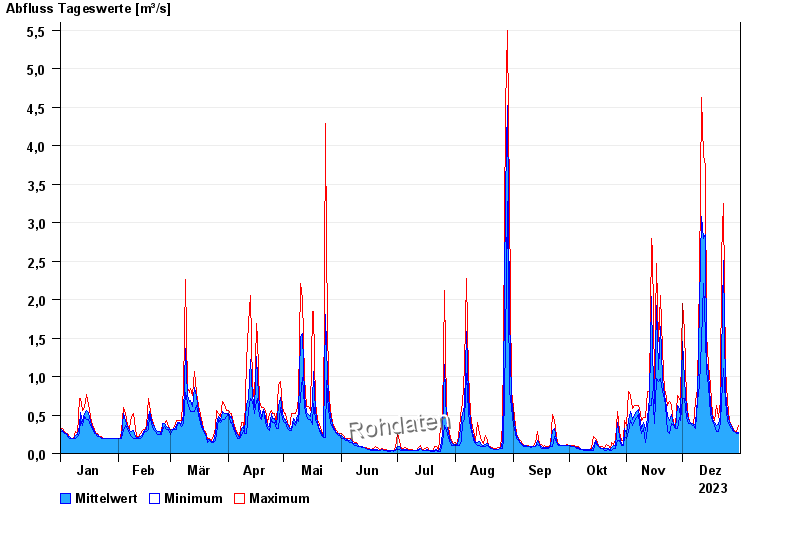
| Date | Mean value [m³/s] | Maximum [m³/s] | Minimum [m³/s] |
|---|---|---|---|
| 31.12.2023 | 0.278 | 0.358 | 0.254 |
| 30.12.2023 | 0.27 | 0.288 | 0.254 |
| 29.12.2023 | 0.288 | 0.288 | 0.288 |
| 28.12.2023 | 0.297 | 0.323 | 0.288 |
| 27.12.2023 | 0.346 | 0.358 | 0.323 |
| 26.12.2023 | 0.397 | 0.432 | 0.358 |
| 25.12.2023 | 0.535 | 0.672 | 0.432 |
© Bayerisches Landesamt für Umwelt 2024