
- Start >
- Rivers >
- Discharge >
- Iller - Lech - Bodensee >
- Gschwend >
- Chart of year

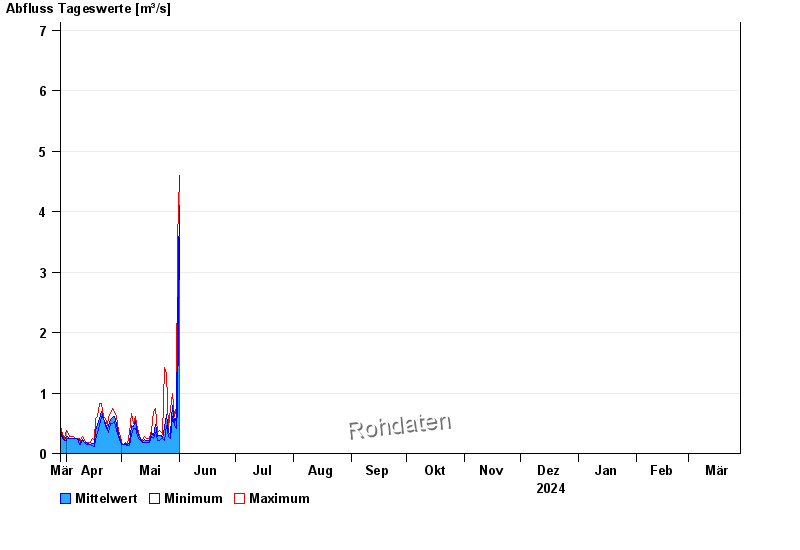
Chart of year Gschwend / Rottach
Discharge from 29.03.2024 to 28.03.2025
- 23.08.2005 Abfluss: 16,2 m³/s
- 12.08.2002 Abfluss: 15 m³/s
- 02.06.2013 Abfluss: 13,4 m³/s
- 18.07.1997 Abfluss: 10,6 m³/s
- 21.09.2000 Abfluss: 10,4 m³/s
| Date | Mean value [m³/s] | Maximum [m³/s] | Minimum [m³/s] |
|---|---|---|---|
| 09.05.2024 | 0.435 | 0.494 | 0.381 |
| 08.05.2024 | 0.546 | 0.614 | 0.418 |
| 07.05.2024 | 0.444 | 0.494 | 0.418 |
| 06.05.2024 | 0.458 | 0.656 | 0.309 |
| 05.05.2024 | 0.174 | 0.344 | 0.131 |
| 04.05.2024 | 0.153 | 0.154 | 0.131 |
| 03.05.2024 | 0.158 | 0.179 | 0.154 |
© Bayerisches Landesamt für Umwelt 2024