
- Start >
- Rivers >
- Discharge >
- Iller - Lech - Bodensee >
- Gruben >
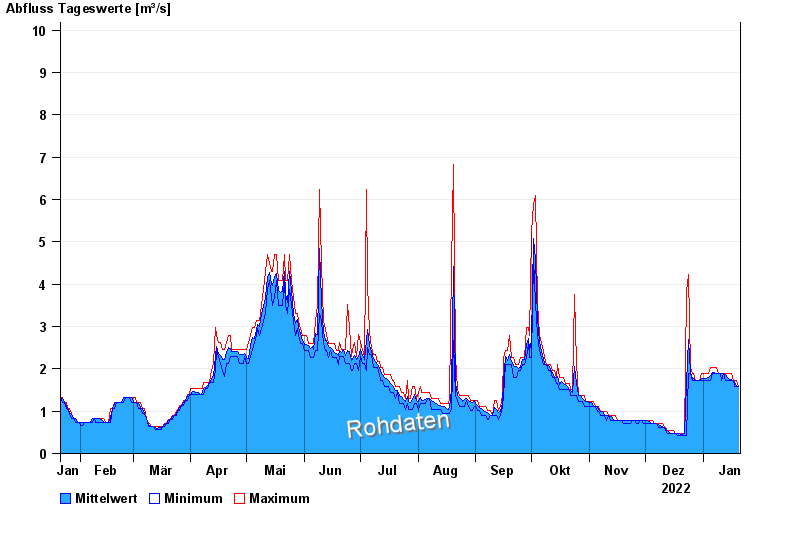
- Chart of year

Chart of year Gruben / Oybach
Discharge from 21.01.2022 to 20.01.2023
Abflusswerte unsicher
Beeinflussung durch Baumaßnahme
- 22.05.1999 Abfluss: 75,7 m³/s
- 12.08.2002 Abfluss: 35,6 m³/s
- 16.04.1983 Abfluss: 26,5 m³/s
- 01.08.1970 Abfluss: 22,8 m³/s
- 01.08.1960 Abfluss: 21,1 m³/s
| Date | Mean value [m³/s] | Maximum [m³/s] | Minimum [m³/s] |
|---|---|---|---|
| 20.01.2023 | 1.58 | 1.58 | 1.58 |
| 19.01.2023 | 1.58 | 1.73 | 1.58 |
| 18.01.2023 | 1.67 | 1.73 | 1.58 |
| 17.01.2023 | 1.73 | 1.73 | 1.73 |
| 16.01.2023 | 1.74 | 1.88 | 1.73 |
| 15.01.2023 | 1.75 | 1.88 | 1.73 |
| 14.01.2023 | 1.8 | 1.88 | 1.73 |
© Bayerisches Landesamt für Umwelt 2024