
- Start >
- Rivers >
- Discharge >
- Iller - Lech - Bodensee >
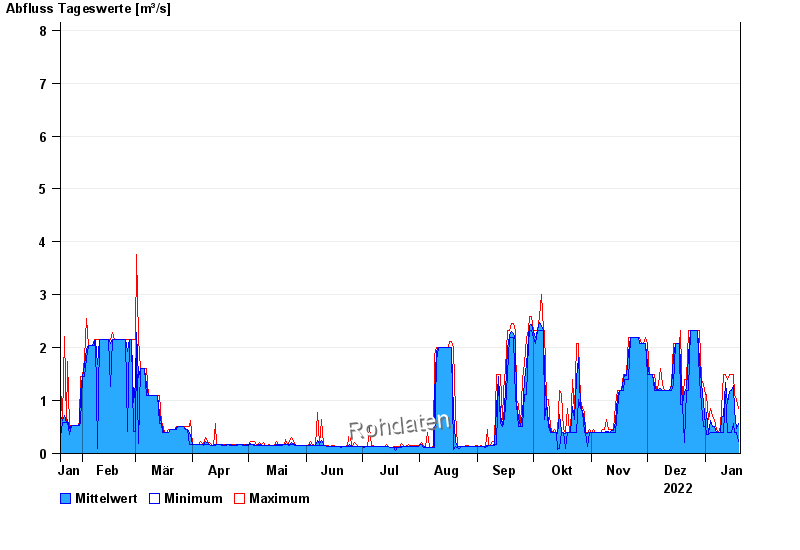
- Greifenmühle >
- Chart of year

Chart of year Greifenmühle / Rottach
Discharge from 20.01.2022 to 19.01.2023
- HQ100 15 m³/s
| Date | Mean value [m³/s] | Maximum [m³/s] | Minimum [m³/s] |
|---|---|---|---|
| 19.01.2023 | 0.567 | 0.856 | 0.23 |
| 18.01.2023 | 0.465 | 1.02 | 0.399 |
| 17.01.2023 | 0.811 | 1.11 | 0.399 |
| 16.01.2023 | 1.28 | 1.5 | 0.57 |
| 15.01.2023 | 1.19 | 1.5 | 0.399 |
| 14.01.2023 | 1.17 | 1.5 | 0.399 |
| 13.01.2023 | 0.947 | 1.39 | 0.399 |
© Bayerisches Landesamt für Umwelt 2024