
- Start >
- Rivers >
- Discharge >
- Iller - Lech - Bodensee >
- Greifenmühle >
- Chart of year

Chart of year Greifenmühle / Rottach
Discharge from 11.08.2019 to 10.08.2020
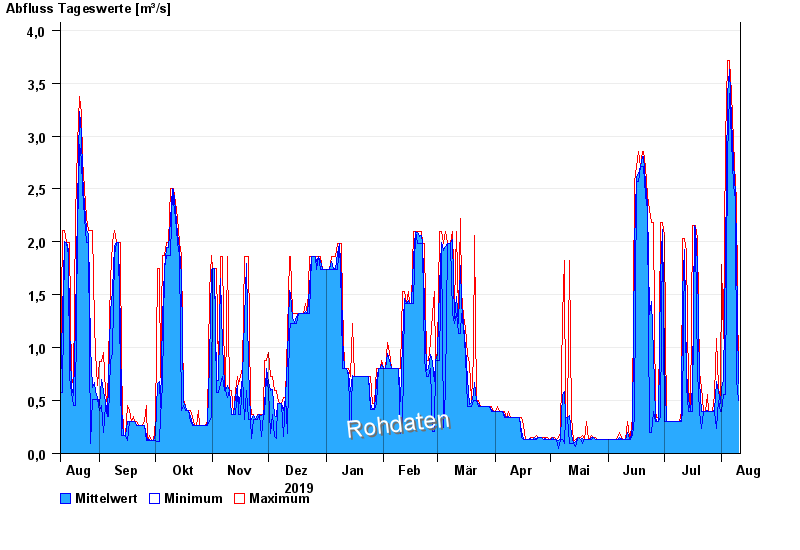
| Date | Mean value [m³/s] | Maximum [m³/s] | Minimum [m³/s] |
|---|---|---|---|
| 10.08.2020 | 0.662 | 0.691 | 0.502 |
| 09.08.2020 | 1.89 | 2.4 | 0.691 |
| 08.08.2020 | 2.46 | 2.53 | 2.4 |
| 07.08.2020 | 2.74 | 2.95 | 2.53 |
| 06.08.2020 | 3.16 | 3.4 | 2.95 |
| 05.08.2020 | 3.63 | 3.71 | 3.4 |
| 04.08.2020 | 3.39 | 3.71 | 2.81 |
© Bayerisches Landesamt für Umwelt 2024