
- Start >
- Rivers >
- Discharge >
- Iller - Lech - Bodensee >
- Greifenmühle >
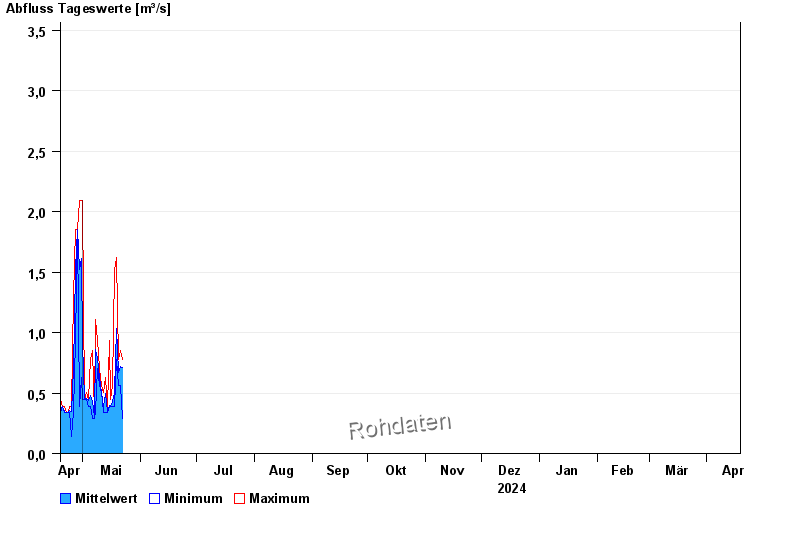
- Chart of year

Chart of year Greifenmühle / Rottach
Discharge from 19.04.2024 to 18.04.2025
- 10.08.1970 Abfluss: 37,4 m³/s
- 10.08.1984 Abfluss: 37,1 m³/s
- 14.06.1983 Abfluss: 35,8 m³/s
- 08.08.1978 Abfluss: 33,8 m³/s
- 18.06.1970 Abfluss: 33,8 m³/s
| Date | Mean value [m³/s] | Maximum [m³/s] | Minimum [m³/s] |
|---|---|---|---|
| 01.05.2024 | 1.2 | 2.09 | 0.501 |
| 30.04.2024 | 1.61 | 2.09 | 0.631 |
| 29.04.2024 | 1.52 | 2.09 | 0.389 |
| 28.04.2024 | 1.85 | 1.85 | 1.85 |
| 27.04.2024 | 1.52 | 1.85 | 0.938 |
| 26.04.2024 | 0.704 | 1.3 | 0.339 |
| 25.04.2024 | 0.348 | 0.389 | 0.138 |
© Bayerisches Landesamt für Umwelt 2024