
- Start >
- Rivers >
- Discharge >
- Iller - Lech - Bodensee >
- Greifenmühle >
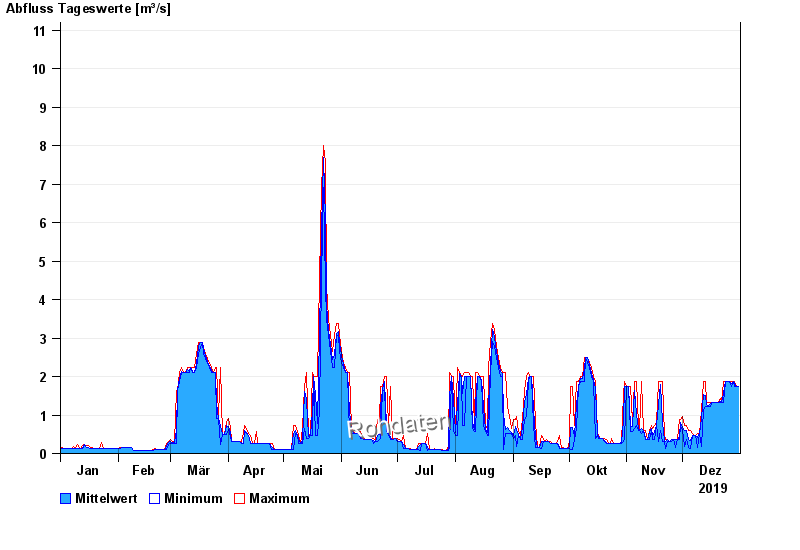
- Chart of year

Chart of year Greifenmühle / Rottach
Discharge from 01.01.2019 to 31.12.2019
- 10.08.1970 Abfluss: 37,4 m³/s
- 10.08.1984 Abfluss: 37,1 m³/s
- 14.06.1983 Abfluss: 35,8 m³/s
- 08.08.1978 Abfluss: 33,8 m³/s
- 18.06.1970 Abfluss: 33,8 m³/s
| Date | Mean value [m³/s] | Maximum [m³/s] | Minimum [m³/s] |
|---|---|---|---|
| 31.12.2019 | 1.74 | 1.74 | 1.74 |
| 30.12.2019 | 1.74 | 1.74 | 1.74 |
| 29.12.2019 | 1.81 | 1.86 | 1.74 |
| 28.12.2019 | 1.86 | 1.86 | 1.86 |
| 27.12.2019 | 1.81 | 1.86 | 1.74 |
| 26.12.2019 | 1.86 | 1.86 | 1.86 |
| 25.12.2019 | 1.86 | 1.86 | 1.86 |
© Bayerisches Landesamt für Umwelt 2024