
- Start >
- Rivers >
- Discharge >
- Iller - Lech - Bodensee >
- Greifenmühle >
- Chart of year

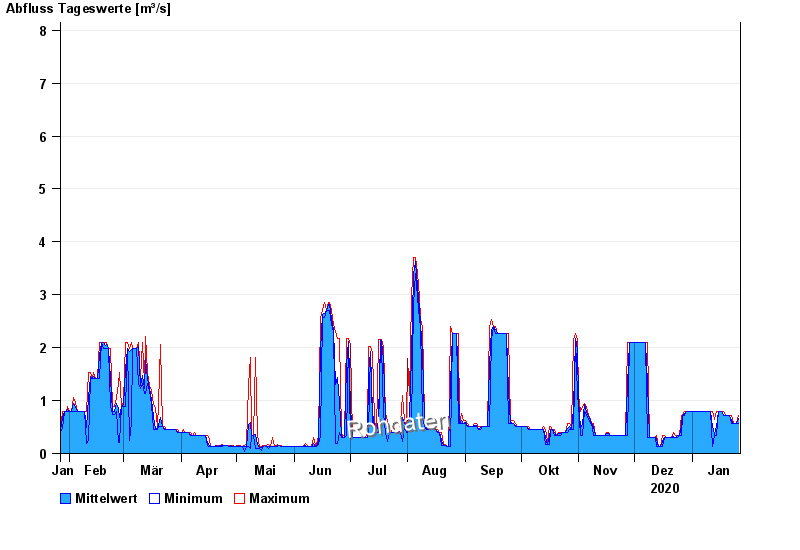
Chart of year Greifenmühle / Rottach
Discharge from 27.01.2020 to 26.01.2021
- HQ100 15 m³/s
| Date | Mean value [m³/s] | Maximum [m³/s] | Minimum [m³/s] |
|---|---|---|---|
| 26.01.2021 | 0.659 | 0.711 | 0.57 |
| 25.01.2021 | 0.57 | 0.57 | 0.57 |
| 24.01.2021 | 0.57 | 0.57 | 0.57 |
| 23.01.2021 | 0.57 | 0.57 | 0.57 |
| 22.01.2021 | 0.623 | 0.711 | 0.57 |
| 21.01.2021 | 0.711 | 0.711 | 0.711 |
| 20.01.2021 | 0.711 | 0.711 | 0.711 |
© Bayerisches Landesamt für Umwelt 2024