
- Start >
- Rivers >
- Discharge >
- Iller - Lech - Bodensee >
- Görisried >
- Chart of year

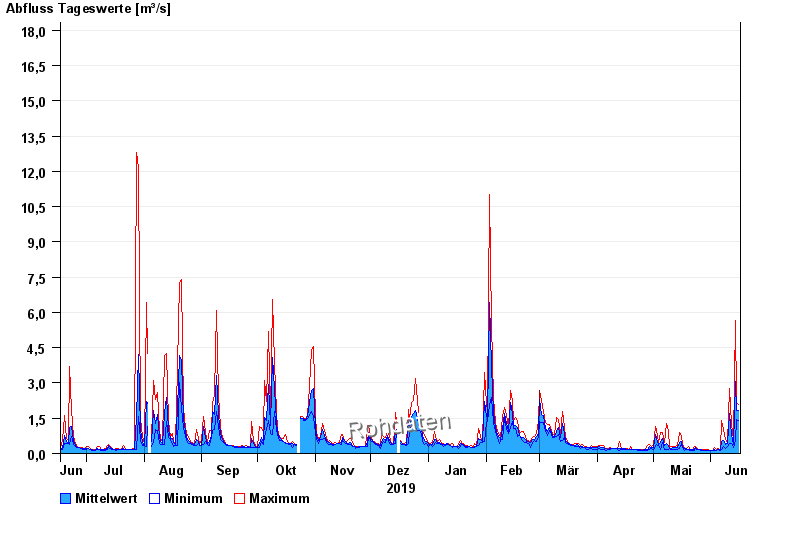
Chart of year Görisried / Waldbach
Discharge from 17.06.2019 to 16.06.2020
- 21.06.1943 Abfluss: 120 m³/s
- 20.07.2007 Abfluss: 56,8 m³/s
- 15.07.2002 Abfluss: 45,3 m³/s
- 21.06.1953 Abfluss: 42,6 m³/s
- 18.03.1944 Abfluss: 41,7 m³/s
| Date | Mean value [m³/s] | Maximum [m³/s] | Minimum [m³/s] |
|---|---|---|---|
| 16.06.2020 | 1.82 | 2.09 | 1.39 |
| 15.06.2020 | 1.81 | 2.17 | 1.46 |
| 14.06.2020 | 3.05 | 5.65 | 0.536 |
| 13.06.2020 | 0.4 | 0.536 | 0.26 |
| 12.06.2020 | 0.796 | 1.26 | 0.418 |
| 11.06.2020 | 1.68 | 2.78 | 0.418 |
| 10.06.2020 | 0.423 | 0.454 | 0.318 |
© Bayerisches Landesamt für Umwelt 2024