
- Start >
- Rivers >
- Discharge >
- Iller - Lech - Bodensee >
- Görisried >
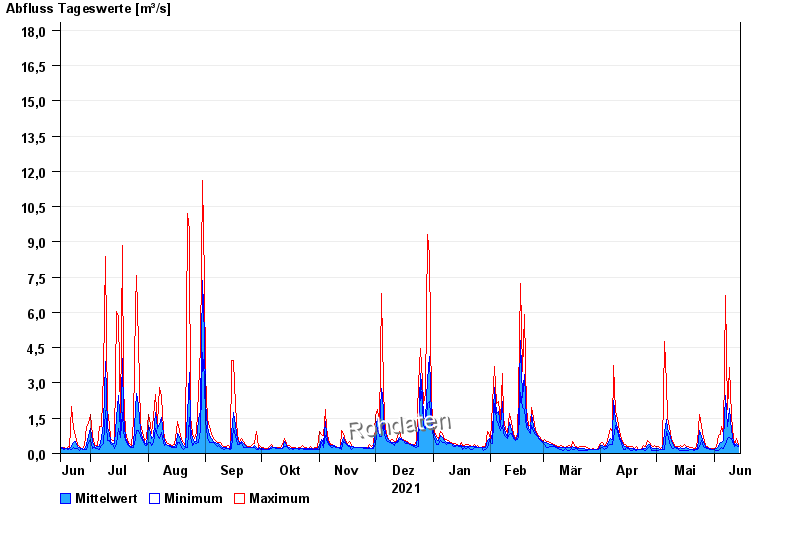
- Chart of year

Chart of year Görisried / Waldbach
Discharge from 15.06.2021 to 14.06.2022
- 21.06.1943 Abfluss: 120 m³/s
- 20.07.2007 Abfluss: 56,8 m³/s
- 15.07.2002 Abfluss: 45,3 m³/s
- 21.06.1953 Abfluss: 42,6 m³/s
- 18.03.1944 Abfluss: 41,7 m³/s
| Date | Mean value [m³/s] | Maximum [m³/s] | Minimum [m³/s] |
|---|---|---|---|
| 14.06.2022 | 0.353 | 0.397 | 0.286 |
| 13.06.2022 | 0.437 | 0.619 | 0.32 |
| 12.06.2022 | 0.357 | 0.397 | 0.286 |
| 11.06.2022 | 0.496 | 0.619 | 0.397 |
| 10.06.2022 | 0.986 | 1.56 | 0.619 |
| 09.06.2022 | 1.9 | 3.65 | 0.67 |
| 08.06.2022 | 1.15 | 1.89 | 0.619 |
© Bayerisches Landesamt für Umwelt 2024