
- Start >
- Rivers >
- Discharge >
- Iller - Lech - Bodensee >
- Görisried >
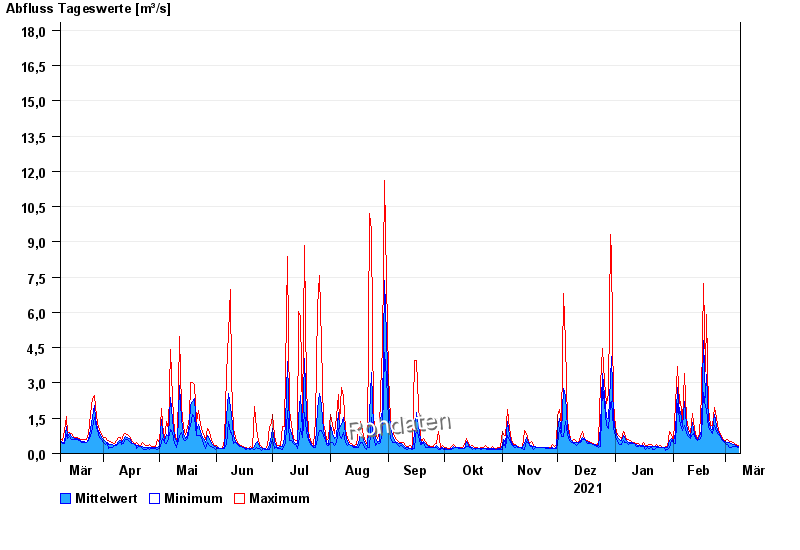
- Chart of year

Chart of year Görisried / Waldbach
Discharge from 09.03.2021 to 08.03.2022
- 21.06.1943 Abfluss: 120 m³/s
- 20.07.2007 Abfluss: 56,8 m³/s
- 15.07.2002 Abfluss: 45,3 m³/s
- 21.06.1953 Abfluss: 42,6 m³/s
- 18.03.1944 Abfluss: 41,7 m³/s
| Date | Mean value [m³/s] | Maximum [m³/s] | Minimum [m³/s] |
|---|---|---|---|
| 08.03.2022 | 0.293 | 0.348 | 0.245 |
| 07.03.2022 | 0.347 | 0.387 | 0.312 |
| 06.03.2022 | 0.364 | 0.428 | 0.312 |
| 05.03.2022 | 0.402 | 0.469 | 0.312 |
| 04.03.2022 | 0.444 | 0.513 | 0.245 |
| 03.03.2022 | 0.463 | 0.513 | 0.245 |
| 02.03.2022 | 0.469 | 0.606 | 0.387 |
© Bayerisches Landesamt für Umwelt 2024