
- Start >
- Rivers >
- Discharge >
- Iller - Lech - Bodensee >
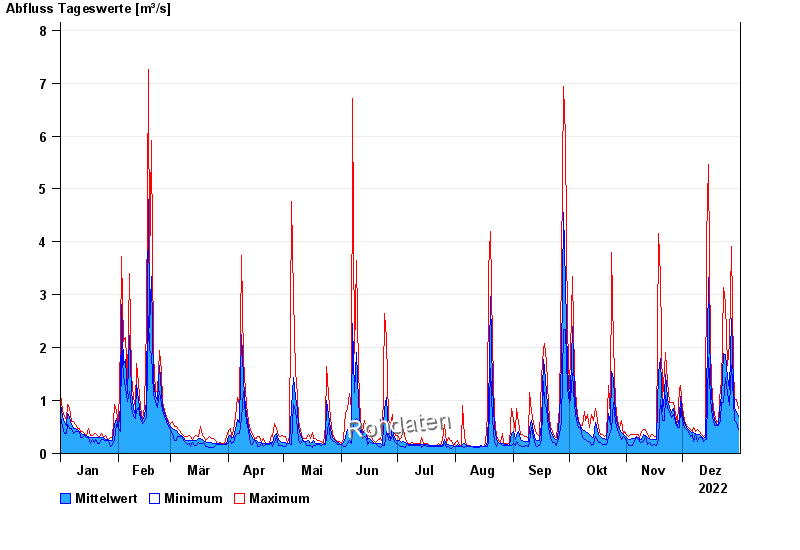
- Görisried >
- Chart of year

Chart of year Görisried / Waldbach
Discharge from 01.01.2022 to 31.12.2022
| Date | Mean value [m³/s] | Maximum [m³/s] | Minimum [m³/s] |
|---|---|---|---|
| 31.12.2022 | 0.702 | 0.843 | 0.449 |
| 30.12.2022 | 0.784 | 1.02 | 0.584 |
| 29.12.2022 | 0.861 | 1.02 | 0.632 |
| 28.12.2022 | 1.26 | 1.66 | 1.02 |
| 27.12.2022 | 2.56 | 3.91 | 1.66 |
| 26.12.2022 | 1.21 | 2.07 | 0.9 |
| 25.12.2022 | 1.44 | 1.66 | 1.15 |
© Bayerisches Landesamt für Umwelt 2024