
- Start >
- Rivers >
- Discharge >
- Iller - Lech - Bodensee >
- Fischach >
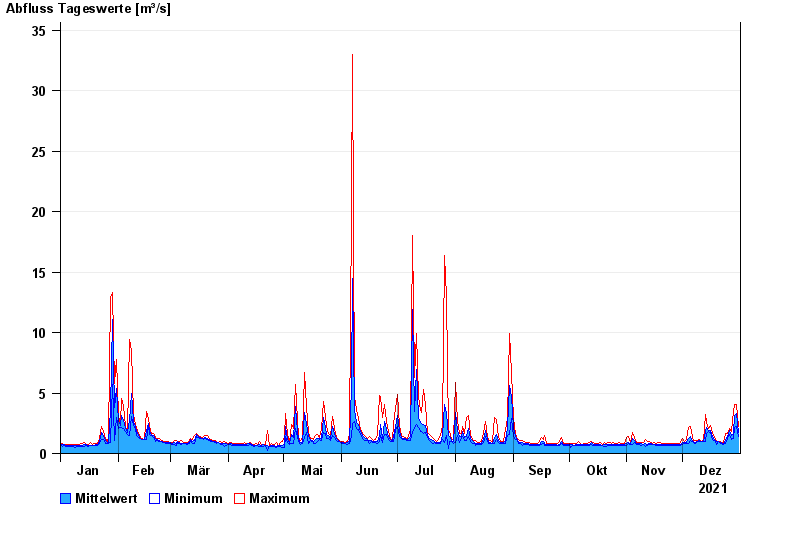
- Chart of year

Chart of year Fischach / Schmutter
Discharge from 01.01.2021 to 31.12.2021
| Date | Mean value [m³/s] | Maximum [m³/s] | Minimum [m³/s] |
|---|---|---|---|
| 31.12.2021 | 1.7 | 2.23 | 1.41 |
| 30.12.2021 | 3.34 | 4.08 | 2.23 |
| 29.12.2021 | 3.16 | 4.08 | 2.16 |
| 28.12.2021 | 1.63 | 3.47 | 1.27 |
| 27.12.2021 | 1.48 | 1.78 | 1.14 |
| 26.12.2021 | 1.94 | 2.08 | 1.56 |
| 25.12.2021 | 1.39 | 1.63 | 1.28 |
© Bayerisches Landesamt für Umwelt 2024