
- Start >
- Rivers >
- Discharge >
- Iller - Lech - Bodensee >
- Eschach >
- Chart of year

Chart of year Eschach / Füssener Achen
Discharge from 20.10.2021 to 19.10.2022
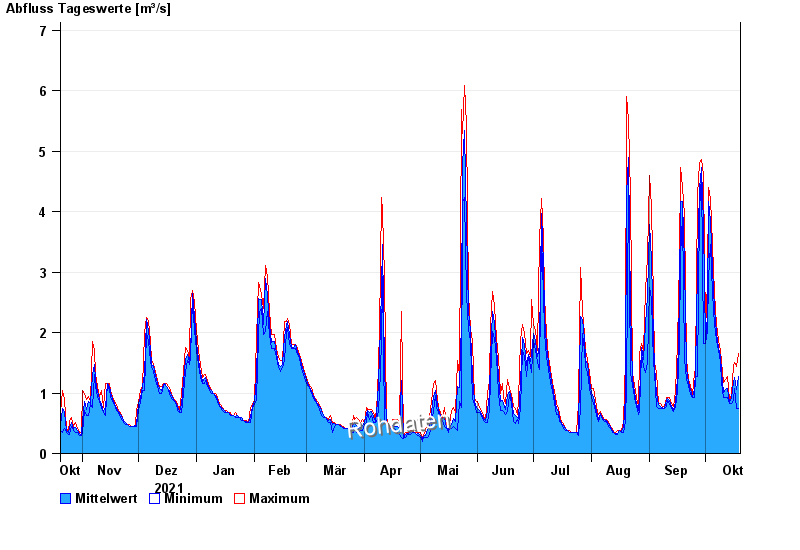
| Date | Mean value [m³/s] | Maximum [m³/s] | Minimum [m³/s] |
|---|---|---|---|
| 19.10.2022 | 1.27 | 1.66 | 0.739 |
| 18.10.2022 | 1.06 | 1.44 | 0.739 |
| 17.10.2022 | 1.25 | 1.5 | 1.08 |
| 16.10.2022 | 1.17 | 1.44 | 0.878 |
| 15.10.2022 | 0.917 | 0.973 | 0.829 |
| 14.10.2022 | 0.849 | 0.878 | 0.829 |
| 13.10.2022 | 1.07 | 1.28 | 0.928 |
© Bayerisches Landesamt für Umwelt 2024