
- Start >
- Rivers >
- Discharge >
- Iller - Lech - Bodensee >
- Eschach >
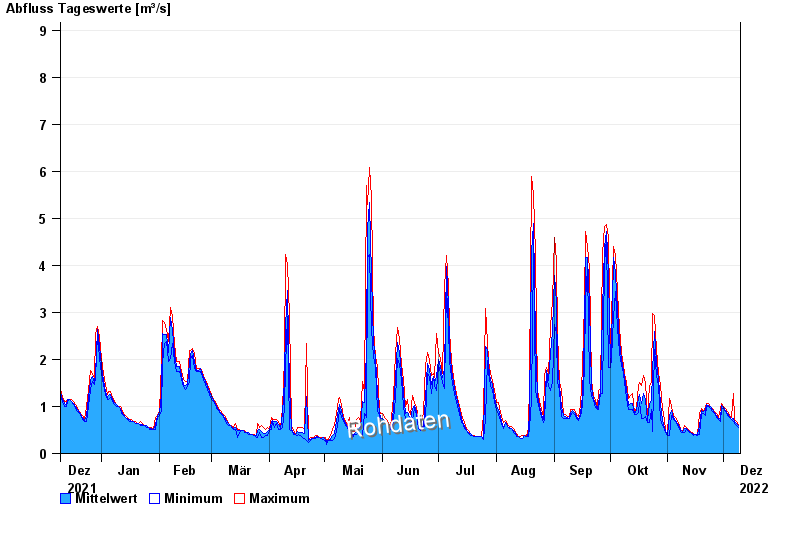
- Chart of year

Chart of year Eschach / Füssener Achen
Discharge from 10.12.2021 to 09.12.2022
- 23.08.2005 Abfluss: 14 m³/s
- 22.05.1999 Abfluss: 12,3 m³/s
- 18.06.1979 Abfluss: 11,8 m³/s
- 18.07.1997 Abfluss: 11,3 m³/s
- 22.03.1988 Abfluss: 10,8 m³/s
| Date | Mean value [m³/s] | Maximum [m³/s] | Minimum [m³/s] |
|---|---|---|---|
| 09.12.2022 | 0.589 | 0.591 | 0.551 |
| 08.12.2022 | 0.644 | 0.673 | 0.591 |
| 07.12.2022 | 0.688 | 0.717 | 0.631 |
| 06.12.2022 | 0.738 | 1.27 | 0.673 |
| 05.12.2022 | 0.724 | 0.761 | 0.717 |
| 04.12.2022 | 0.782 | 0.807 | 0.761 |
| 03.12.2022 | 0.847 | 0.902 | 0.807 |
© Bayerisches Landesamt für Umwelt 2024