
- Start >
- Rivers >
- Discharge >
- Iller - Lech - Bodensee >
- Eschach >
- Chart of year

Chart of year Eschach / Füssener Achen
Discharge from 02.12.2023 to 01.12.2024
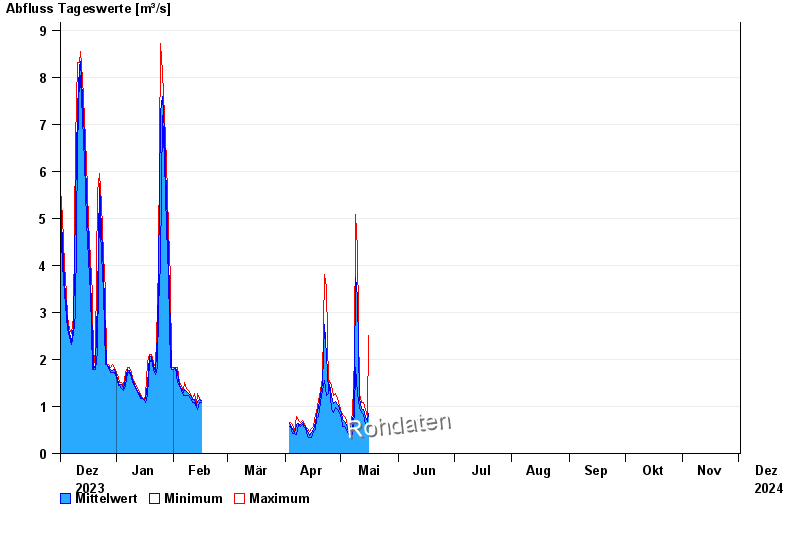
| Date | Mean value [m³/s] | Maximum [m³/s] | Minimum [m³/s] |
|---|---|---|---|
| 29.04.2024 | 1.04 | 1.18 | 0.928 |
| 28.04.2024 | 1.11 | 1.28 | 0.976 |
| 27.04.2024 | 1.06 | 1.23 | 0.879 |
| 26.04.2024 | 1.22 | 1.44 | 0.928 |
| 25.04.2024 | 1.47 | 1.55 | 1.44 |
| 24.04.2024 | 1.32 | 1.44 | 1.28 |
| 23.04.2024 | 2.09 | 3.54 | 1.23 |
© Bayerisches Landesamt für Umwelt 2024