
- Start >
- Rivers >
- Discharge >
- Iller - Lech - Bodensee >
- Eschach >
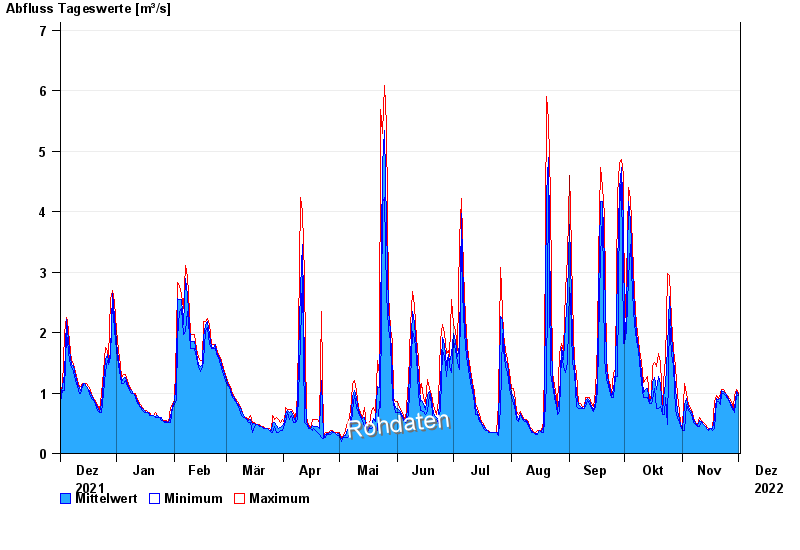
- Chart of year

Chart of year Eschach / Füssener Achen
Discharge from 02.12.2021 to 01.12.2022
| Date | Mean value [m³/s] | Maximum [m³/s] | Minimum [m³/s] |
|---|---|---|---|
| 01.12.2022 | 0.982 | 1 | 0.953 |
| 30.11.2022 | 1.02 | 1.06 | 0.953 |
| 29.11.2022 | 0.75 | 0.953 | 0.673 |
| 28.11.2022 | 0.728 | 0.761 | 0.717 |
| 27.11.2022 | 0.814 | 0.854 | 0.761 |
| 26.11.2022 | 0.868 | 0.902 | 0.854 |
| 25.11.2022 | 0.928 | 0.953 | 0.902 |
© Bayerisches Landesamt für Umwelt 2024