
- Start >
- Rivers >
- Discharge >
- Iller - Lech - Bodensee >
- Eschach >
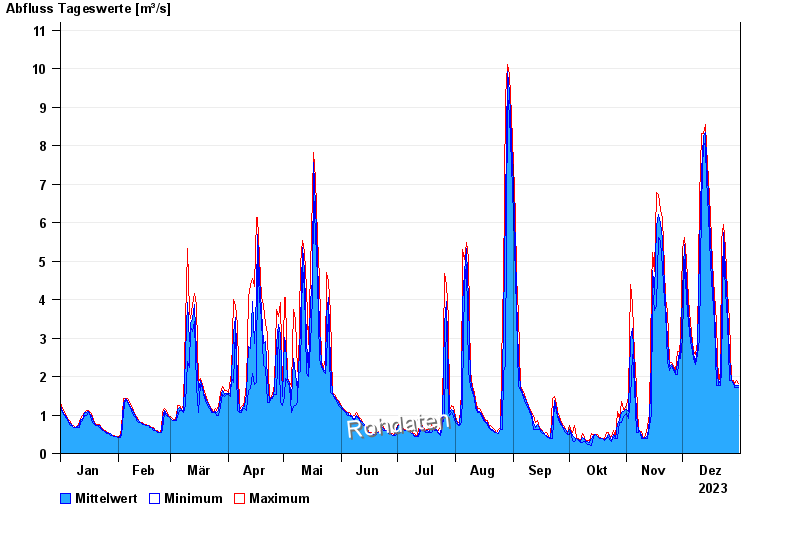
- Chart of year

Chart of year Eschach / Füssener Achen
Discharge from 01.01.2023 to 31.12.2023
| Date | Mean value [m³/s] | Maximum [m³/s] | Minimum [m³/s] |
|---|---|---|---|
| 31.12.2023 | 1.78 | 1.83 | 1.72 |
| 30.12.2023 | 1.77 | 1.89 | 1.72 |
| 29.12.2023 | 1.78 | 1.83 | 1.72 |
| 28.12.2023 | 1.84 | 1.89 | 1.83 |
| 27.12.2023 | 1.89 | 1.89 | 1.89 |
| 26.12.2023 | 2.49 | 3.45 | 1.89 |
| 25.12.2023 | 3.85 | 4.22 | 3.45 |
© Bayerisches Landesamt für Umwelt 2024