
- Start >
- Rivers >
- Discharge >
- Iller - Lech - Bodensee >
- Eschach >
- Chart of year

Chart of year Eschach / Füssener Achen
Discharge from 02.12.2023 to 01.12.2024
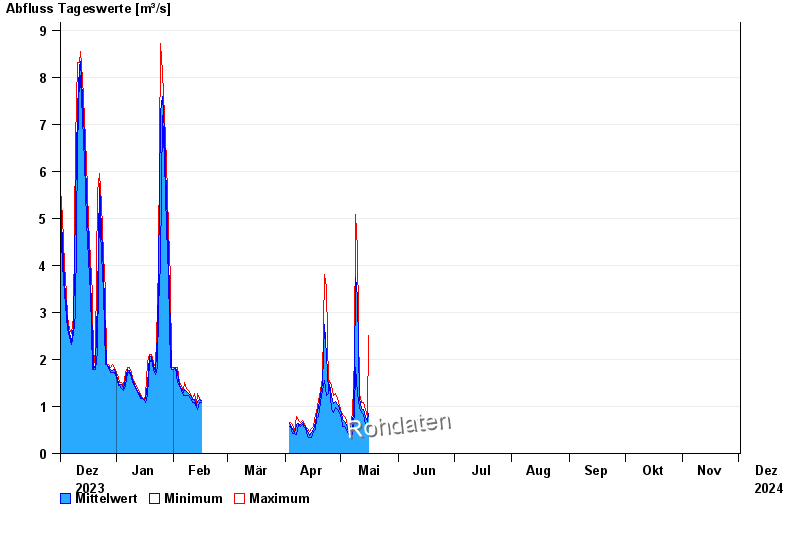
| Date | Mean value [m³/s] | Maximum [m³/s] | Minimum [m³/s] |
|---|---|---|---|
| 01.06.2024 | 7.91 | 7.98 | 7.77 |
| 31.05.2024 | 5.51 | 7.71 | 3.72 |
| 30.05.2024 | 2.87 | 3.94 | 1.44 |
| 29.05.2024 | 2.41 | 4.04 | 1.44 |
| 28.05.2024 | 4.42 | 4.59 | 4.04 |
| 27.05.2024 | 2.05 | 4.35 | 1.28 |
| 26.05.2024 | 1.65 | 1.94 | 1.39 |
© Bayerisches Landesamt für Umwelt 2024