
- Start >
- Rivers >
- Discharge >
- Iller - Lech - Bodensee >
- Eschach >
- Chart of year

Chart of year Eschach / Füssener Achen
Discharge from 10.12.2022 to 09.12.2023
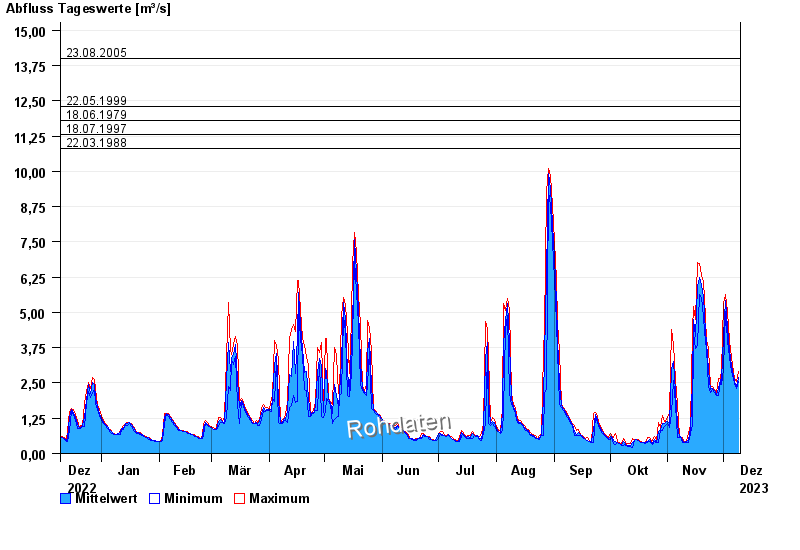
- 23.08.2005 Abfluss: 14 m³/s
- 22.05.1999 Abfluss: 12,3 m³/s
- 18.06.1979 Abfluss: 11,8 m³/s
- 18.07.1997 Abfluss: 11,3 m³/s
- 22.03.1988 Abfluss: 10,8 m³/s
| Date | Mean value [m³/s] | Maximum [m³/s] | Minimum [m³/s] |
|---|---|---|---|
| 09.12.2023 | 2.7 | 2.9 | 2.56 |
| 08.12.2023 | 2.39 | 2.56 | 2.32 |
| 07.12.2023 | 2.56 | 2.66 | 2.46 |
| 06.12.2023 | 2.77 | 2.9 | 2.66 |
| 05.12.2023 | 3.13 | 3.4 | 2.9 |
| 04.12.2023 | 3.66 | 3.99 | 3.4 |
| 03.12.2023 | 4.47 | 5.03 | 3.99 |
© Bayerisches Landesamt für Umwelt 2024