
- Start >
- Rivers >
- Discharge >
- Iller - Lech - Bodensee >
- Eschach >
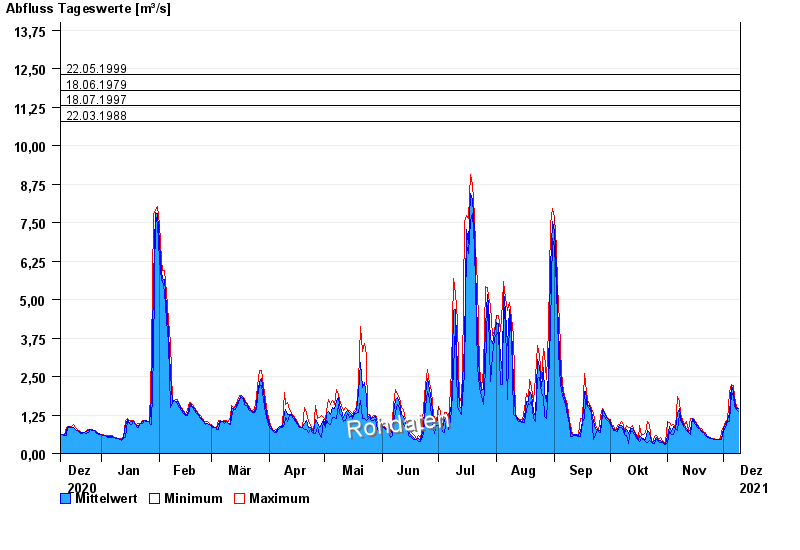
- Chart of year

Chart of year Eschach / Füssener Achen
Discharge from 10.12.2020 to 09.12.2021
- 23.08.2005 Abfluss: 14 m³/s
- 22.05.1999 Abfluss: 12,3 m³/s
- 18.06.1979 Abfluss: 11,8 m³/s
- 18.07.1997 Abfluss: 11,3 m³/s
- 22.03.1988 Abfluss: 10,8 m³/s
| Date | Mean value [m³/s] | Maximum [m³/s] | Minimum [m³/s] |
|---|---|---|---|
| 09.12.2021 | 1.45 | 1.47 | 1.36 |
| 08.12.2021 | 1.47 | 1.53 | 1.42 |
| 07.12.2021 | 1.7 | 1.86 | 1.53 |
| 06.12.2021 | 2.03 | 2.2 | 1.86 |
| 05.12.2021 | 2.22 | 2.25 | 1.98 |
| 04.12.2021 | 1.31 | 1.98 | 1.05 |
| 03.12.2021 | 1.1 | 1.1 | 1.05 |
© Bayerisches Landesamt für Umwelt 2024