
- Start >
- Rivers >
- Discharge >
- Iller - Lech - Bodensee >
- Engen >
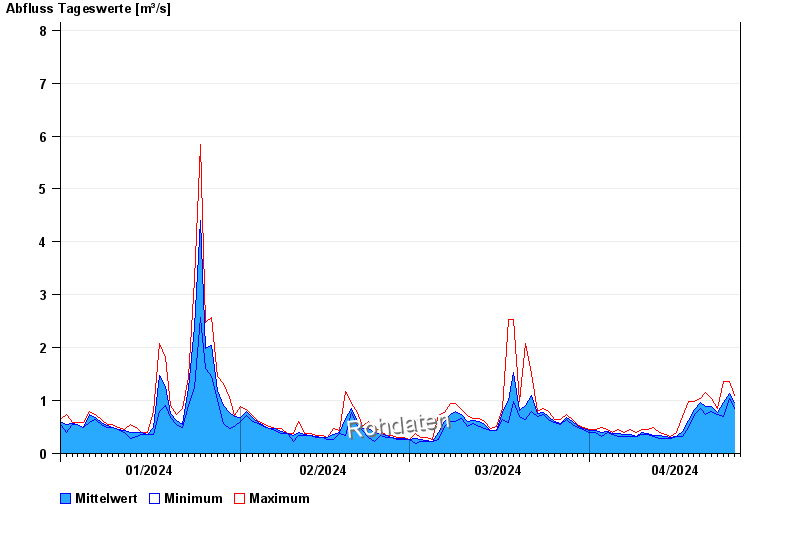
- Chart of year

Chart of year Engen / Illach
Discharge from 01.01.2024 to 26.04.2024
- 30.07.1990 Abfluss: 24,9 m³/s
- 22.05.1999 Abfluss: 23,2 m³/s
- 23.08.2005 Abfluss: 22,1 m³/s
- 26.07.2016 Abfluss: 20,7 m³/s
- 18.06.1979 Abfluss: 20,5 m³/s
| Date | Mean value [m³/s] | Maximum [m³/s] | Minimum [m³/s] |
|---|---|---|---|
| 26.04.2024 | 1.04 | 1.1 | 0.977 |
| 25.04.2024 | 1.14 | 1.36 | 1.04 |
| 24.04.2024 | 0.957 | 1.36 | 0.691 |
| 23.04.2024 | 0.766 | 0.857 | 0.745 |
| 22.04.2024 | 0.88 | 1.04 | 0.797 |
| 21.04.2024 | 0.888 | 1.16 | 0.745 |
| 20.04.2024 | 0.964 | 1.04 | 0.857 |
© Bayerisches Landesamt für Umwelt 2024