
- Start >
- Rivers >
- Discharge >
- Iller - Lech - Bodensee >
- Durach >
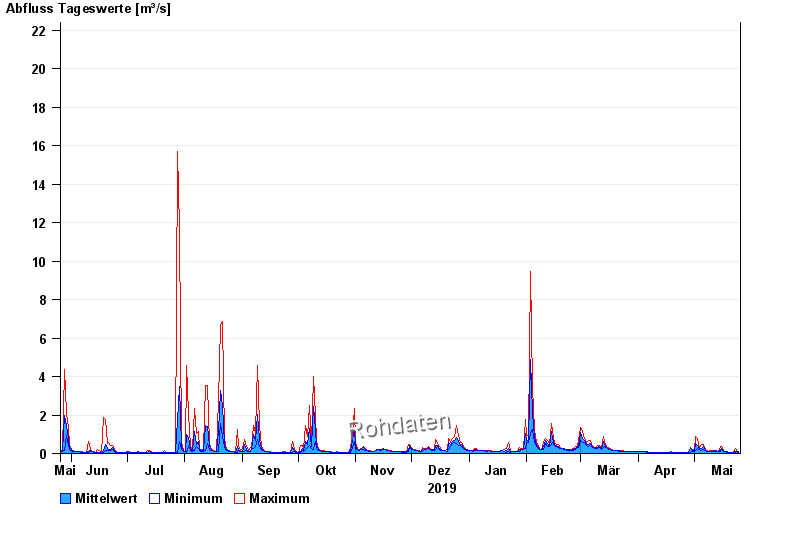
- Chart of year

Chart of year Durach / Durach
Discharge from 26.05.2019 to 25.05.2020
- 22.07.1972 Abfluss: 49 m³/s
- 10.08.1970 Abfluss: 40 m³/s
- 08.08.1978 Abfluss: 30,5 m³/s
- 16.07.2002 Abfluss: 29,1 m³/s
- 02.06.2013 Abfluss: 27,1 m³/s
| Date | Mean value [m³/s] | Maximum [m³/s] | Minimum [m³/s] |
|---|---|---|---|
| 25.05.2020 | 0.086 | 0.092 | 0.077 |
| 24.05.2020 | 0.128 | 0.171 | 0.092 |
| 23.05.2020 | 0.098 | 0.253 | 0.064 |
| 22.05.2020 | 0.064 | 0.077 | 0.064 |
| 21.05.2020 | 0.077 | 0.077 | 0.064 |
| 20.05.2020 | 0.077 | 0.077 | 0.077 |
| 19.05.2020 | 0.08 | 0.092 | 0.077 |
© Bayerisches Landesamt für Umwelt 2024