
- Start >
- Rivers >
- Discharge >
- Iller - Lech - Bodensee >
- Durach >
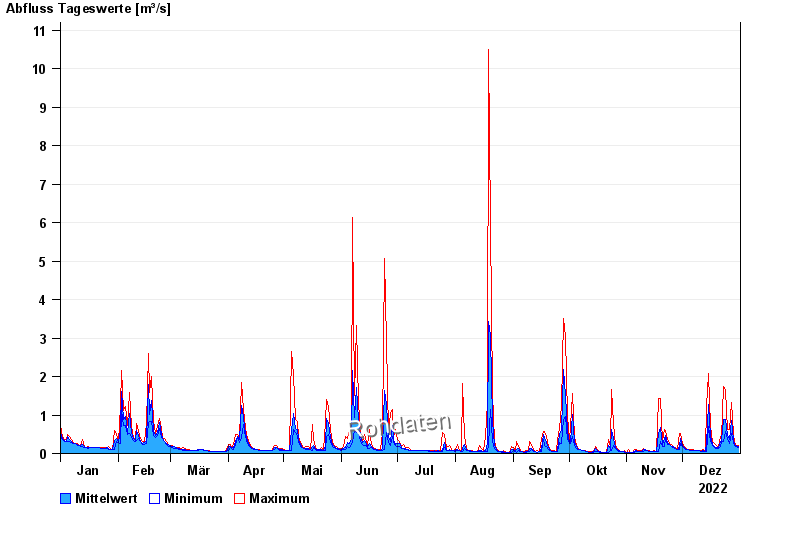
- Chart of year

Chart of year Durach / Durach
Discharge from 01.01.2022 to 31.12.2022
| Date | Mean value [m³/s] | Maximum [m³/s] | Minimum [m³/s] |
|---|---|---|---|
| 31.12.2022 | 0.173 | 0.2 | 0.157 |
| 30.12.2022 | 0.196 | 0.2 | 0.177 |
| 29.12.2022 | 0.227 | 0.286 | 0.2 |
| 28.12.2022 | 0.376 | 0.507 | 0.286 |
| 27.12.2022 | 0.857 | 1.32 | 0.507 |
| 26.12.2022 | 0.364 | 0.631 | 0.254 |
| 25.12.2022 | 0.5 | 0.631 | 0.361 |
© Bayerisches Landesamt für Umwelt 2024