
- Start >
- Rivers >
- Discharge >
- Iller - Lech - Bodensee >
- Durach >
- Chart of year

Chart of year Durach / Durach
Discharge from 28.06.2022 to 27.06.2023
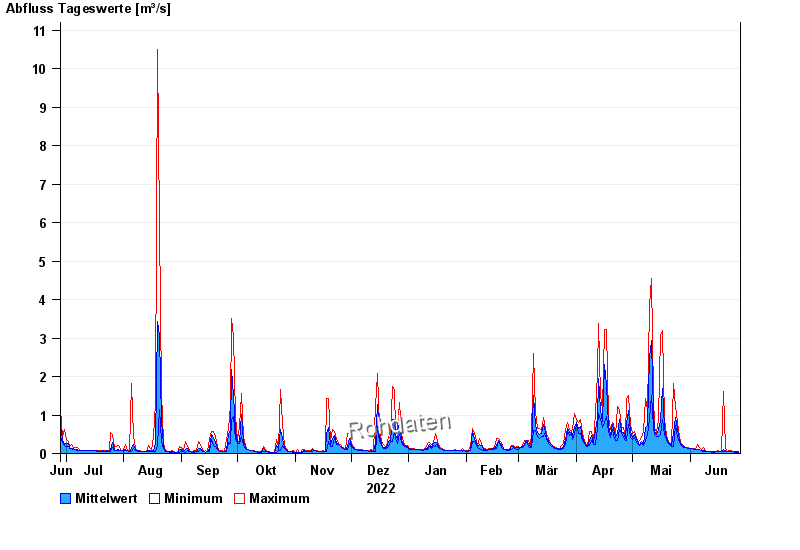
| Date | Mean value [m³/s] | Maximum [m³/s] | Minimum [m³/s] |
|---|---|---|---|
| 27.06.2023 | 0.04 | 0.047 | 0.037 |
| 26.06.2023 | 0.042 | 0.047 | 0.037 |
| 25.06.2023 | 0.045 | 0.047 | 0.037 |
| 24.06.2023 | 0.047 | 0.047 | 0.047 |
| 23.06.2023 | 0.051 | 0.072 | 0.047 |
| 22.06.2023 | 0.049 | 0.086 | 0.047 |
| 21.06.2023 | 0.047 | 0.047 | 0.047 |
© Bayerisches Landesamt für Umwelt 2024