
- Start >
- Rivers >
- Discharge >
- Iller - Lech - Bodensee >
- Durach >
- Chart of year

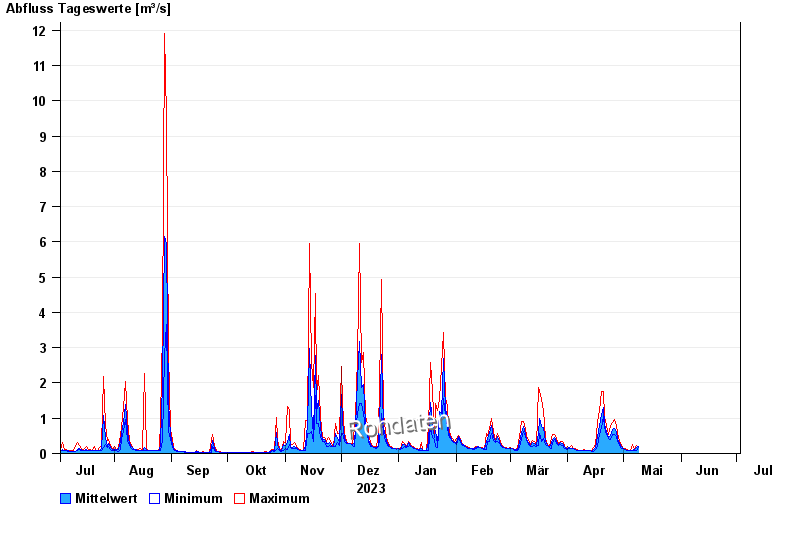
Chart of year Durach / Durach
Discharge from 03.07.2023 to 02.07.2024
| Date | Mean value [m³/s] | Maximum [m³/s] | Minimum [m³/s] |
|---|---|---|---|
| 08.05.2024 | 0.129 | 0.171 | 0.098 |
| 07.05.2024 | 0.103 | 0.113 | 0.098 |
| 06.05.2024 | 0.093 | 0.246 | 0.071 |
| 05.05.2024 | 0.084 | 0.098 | 0.084 |
| 04.05.2024 | 0.097 | 0.098 | 0.084 |
| 03.05.2024 | 0.098 | 0.113 | 0.098 |
| 02.05.2024 | 0.115 | 0.131 | 0.113 |
© Bayerisches Landesamt für Umwelt 2024