
- Start >
- Rivers >
- Discharge >
- Iller - Lech - Bodensee >
- Durach >
- Chart of year

Chart of year Durach / Durach
Discharge from 01.01.2024 to 26.04.2024
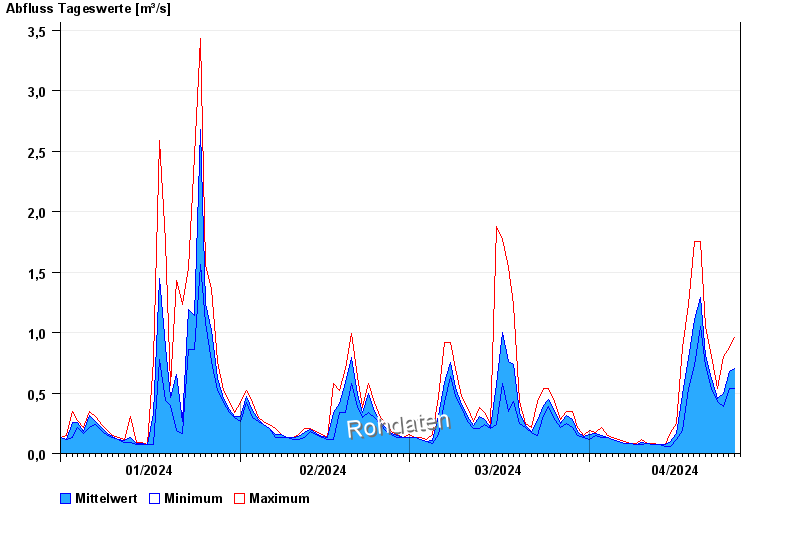
| Date | Mean value [m³/s] | Maximum [m³/s] | Minimum [m³/s] |
|---|---|---|---|
| 26.04.2024 | 0.698 | 0.799 | 0.593 |
| 25.04.2024 | 0.675 | 0.876 | 0.536 |
| 24.04.2024 | 0.497 | 0.799 | 0.389 |
| 23.04.2024 | 0.455 | 0.536 | 0.433 |
| 22.04.2024 | 0.623 | 0.799 | 0.536 |
| 21.04.2024 | 0.81 | 1.05 | 0.725 |
| 20.04.2024 | 1.29 | 1.75 | 1.05 |
© Bayerisches Landesamt für Umwelt 2024