
- Start >
- Rivers >
- Discharge >
- Iller - Lech - Bodensee >
- Durach >
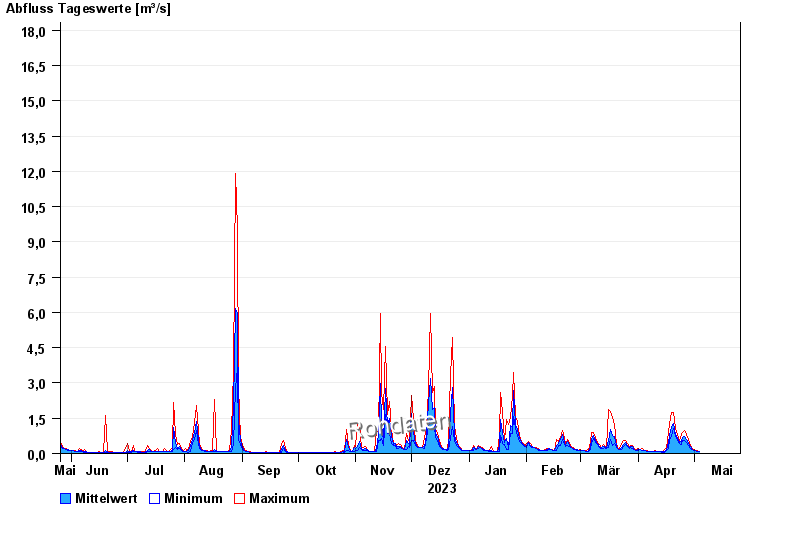
- Chart of year

Chart of year Durach / Durach
Discharge from 26.05.2023 to 25.05.2024
- 22.07.1972 Abfluss: 49 m³/s
- 10.08.1970 Abfluss: 40 m³/s
- 08.08.1978 Abfluss: 30,5 m³/s
- 16.07.2002 Abfluss: 29,1 m³/s
- 02.06.2013 Abfluss: 27,1 m³/s
| Date | Mean value [m³/s] | Maximum [m³/s] | Minimum [m³/s] |
|---|---|---|---|
| 24.05.2024 | 0.18 | 0.218 | 0.15 |
| 23.05.2024 | 0.162 | 0.218 | 0.131 |
| 22.05.2024 | 0.199 | 0.246 | 0.171 |
| 21.05.2024 | 0.132 | 0.246 | 0.071 |
| 20.05.2024 | 0.108 | 0.131 | 0.084 |
| 19.05.2024 | 0.212 | 0.311 | 0.15 |
| 18.05.2024 | 0.095 | 0.218 | 0.071 |
© Bayerisches Landesamt für Umwelt 2024