
- Start >
- Rivers >
- Discharge >
- Iller - Lech - Bodensee >
- Durach >
- Chart of total period

Chart of total period Durach / Durach
Discharge from 01.11.1957 to 07.05.2024
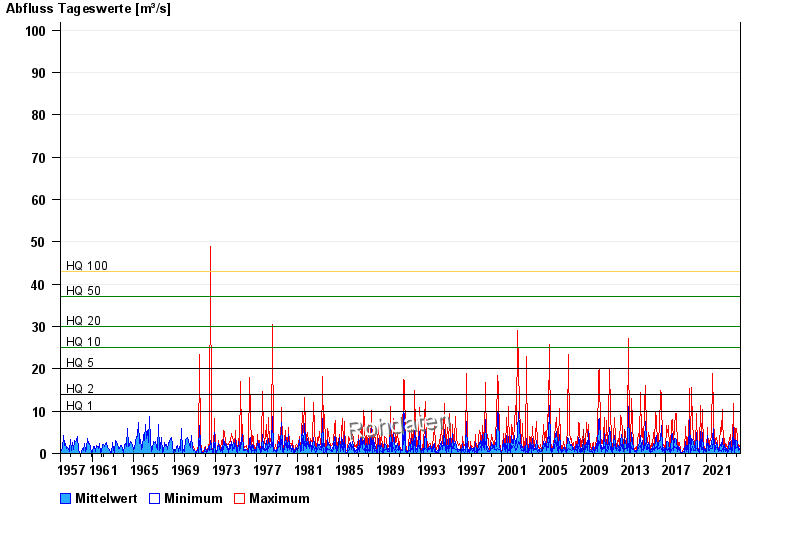
- HQ1 10 m³/s
- HQ2 14 m³/s
- HQ5 20 m³/s
- HQ10 25 m³/s
- HQ20 30 m³/s
- HQ50 37 m³/s
- HQ100 43 m³/s
| Date | Mean value [m³/s] | Maximum [m³/s] | Minimum [m³/s] |
|---|---|---|---|
| 07.05.2024 | 0.108 | 0.113 | 0.098 |
| 06.05.2024 | 0.093 | 0.246 | 0.071 |
| 05.05.2024 | 0.084 | 0.098 | 0.084 |
| 04.05.2024 | 0.097 | 0.098 | 0.084 |
| 03.05.2024 | 0.098 | 0.113 | 0.098 |
| 02.05.2024 | 0.115 | 0.131 | 0.113 |
| 01.05.2024 | 0.143 | 0.15 | 0.131 |
© Bayerisches Landesamt für Umwelt 2024