
- Start >
- Rivers >
- Discharge >
- Iller - Lech - Bodensee >
- Donauwörth >
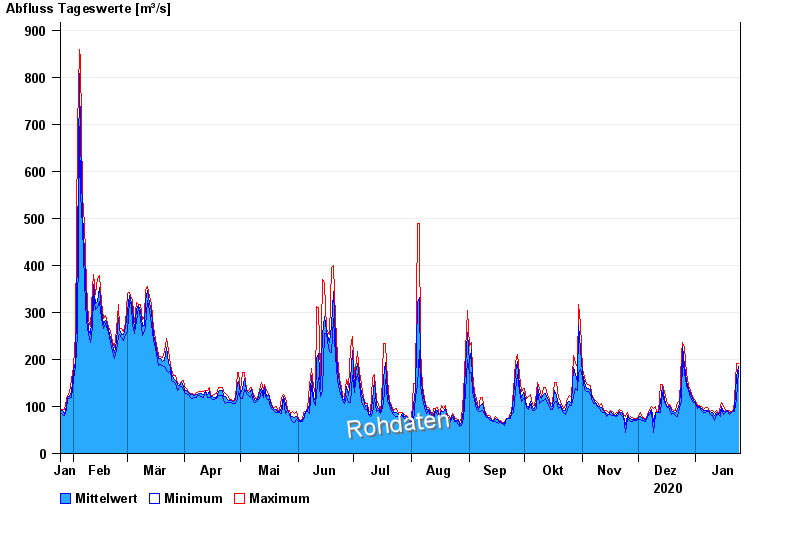
- Chart of year

Chart of year Donauwörth / Donau
Discharge from 25.01.2020 to 24.01.2021
| Date | Mean value [m³/s] | Maximum [m³/s] | Minimum [m³/s] |
|---|---|---|---|
| 24.01.2021 | 185 | 192 | 177 |
| 23.01.2021 | 163 | 192 | 114 |
| 22.01.2021 | 98.4 | 114 | 89.8 |
| 21.01.2021 | 90.4 | 91.9 | 88.3 |
| 20.01.2021 | 87.2 | 88.3 | 86.3 |
| 19.01.2021 | 87.6 | 90.9 | 82.9 |
| 18.01.2021 | 91.3 | 91.9 | 89.8 |
© Bayerisches Landesamt für Umwelt 2024