
- Start >
- Rivers >
- Discharge >
- Iller - Lech - Bodensee >
- Donauwörth >
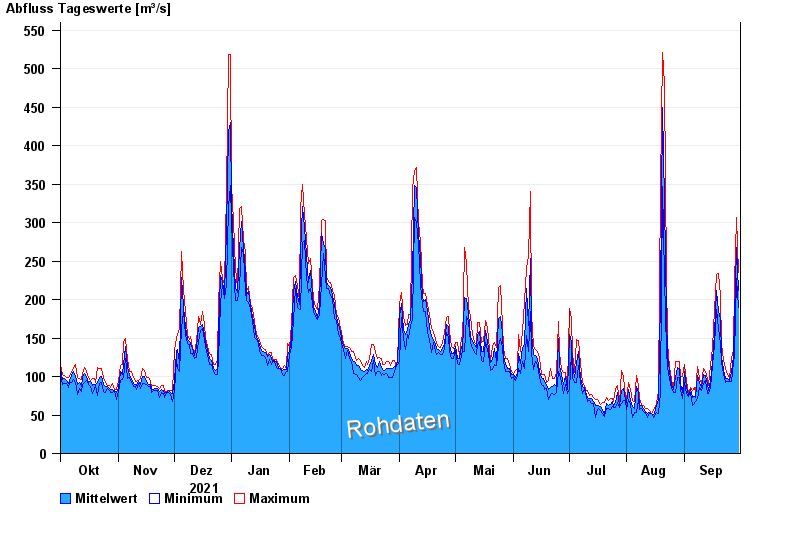
- Chart of year

Chart of year Donauwörth / Donau
Discharge from 01.10.2021 to 30.09.2022
| Date | Mean value [m³/s] | Maximum [m³/s] | Minimum [m³/s] |
|---|---|---|---|
| 30.09.2022 | 212 | 235 | 190 |
| 29.09.2022 | 268 | 306 | 227 |
| 28.09.2022 | 178 | 222 | 127 |
| 27.09.2022 | 127 | 134 | 118 |
| 26.09.2022 | 105 | 124 | 93 |
| 25.09.2022 | 95.1 | 98.6 | 93 |
| 24.09.2022 | 96.9 | 102 | 93 |
© Bayerisches Landesamt für Umwelt 2024