
- Start >
- Rivers >
- Discharge >
- Iller - Lech - Bodensee >
- Buchloe >
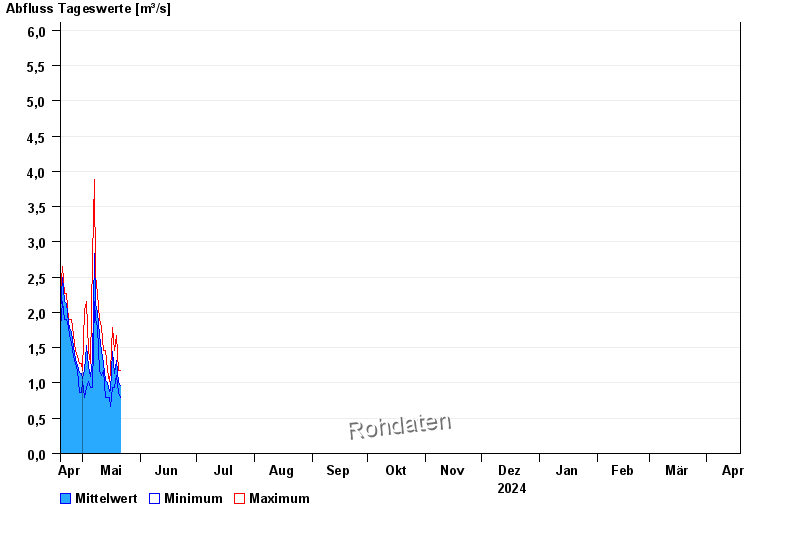
- Chart of year

Chart of year Buchloe / Gennach
Discharge from 19.04.2024 to 18.04.2025
- 23.05.1999 Abfluss: 14,3 m³/s
- 06.08.2000 Abfluss: 13,2 m³/s
- 12.08.2002 Abfluss: 11,7 m³/s
- 12.06.1965 Abfluss: 11,7 m³/s
- 21.09.2000 Abfluss: 11,6 m³/s
| Date | Mean value [m³/s] | Maximum [m³/s] | Minimum [m³/s] |
|---|---|---|---|
| 18.06.2024 | 3.16 | 3.31 | 3.04 |
| 17.06.2024 | 3.11 | 3.31 | 3.04 |
| 16.06.2024 | 3.33 | 3.46 | 3.18 |
| 15.06.2024 | 3.51 | 3.6 | 3.31 |
| 14.06.2024 | 3.71 | 3.89 | 3.6 |
| 13.06.2024 | 4.08 | 4.47 | 3.89 |
| 12.06.2024 | 4.79 | 5.23 | 4.32 |
© Bayerisches Landesamt für Umwelt 2024