
- Start >
- Rivers >
- Discharge >
- Iller - Lech - Bodensee >
- Brunnen >
- Chart of year

Chart of year Brunnen / Mühlberger Ach
Discharge from 24.01.2023 to 23.01.2024
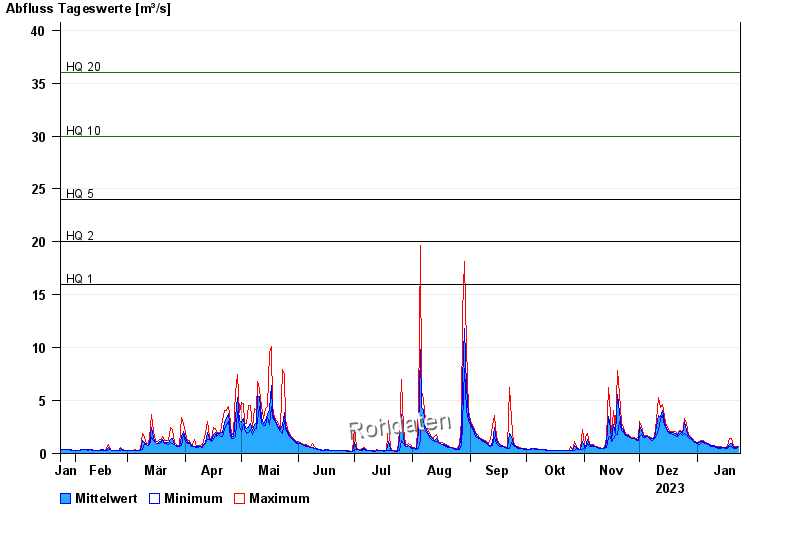
- HQ1 16 m³/s
- HQ2 20 m³/s
- HQ5 24 m³/s
- HQ10 30 m³/s
- HQ20 36 m³/s
- HQ50 44 m³/s
- HQ100 50 m³/s
| Date | Mean value [m³/s] | Maximum [m³/s] | Minimum [m³/s] |
|---|---|---|---|
| 23.01.2024 | 0.698 | 0.707 | 0.631 |
| 22.01.2024 | 0.577 | 0.631 | 0.5 |
| 21.01.2024 | 0.559 | 0.631 | 0.5 |
| 20.01.2024 | 0.596 | 0.707 | 0.5 |
| 19.01.2024 | 0.982 | 1.38 | 0.707 |
| 18.01.2024 | 0.876 | 1.38 | 0.631 |
| 17.01.2024 | 0.524 | 0.631 | 0.5 |
© Bayerisches Landesamt für Umwelt 2024