
- Start >
- Rivers >
- Discharge >
- Iller - Lech - Bodensee >
- Brunnen >
- Chart of year

Chart of year Brunnen / Mühlberger Ach
Discharge from 01.01.2022 to 31.12.2022
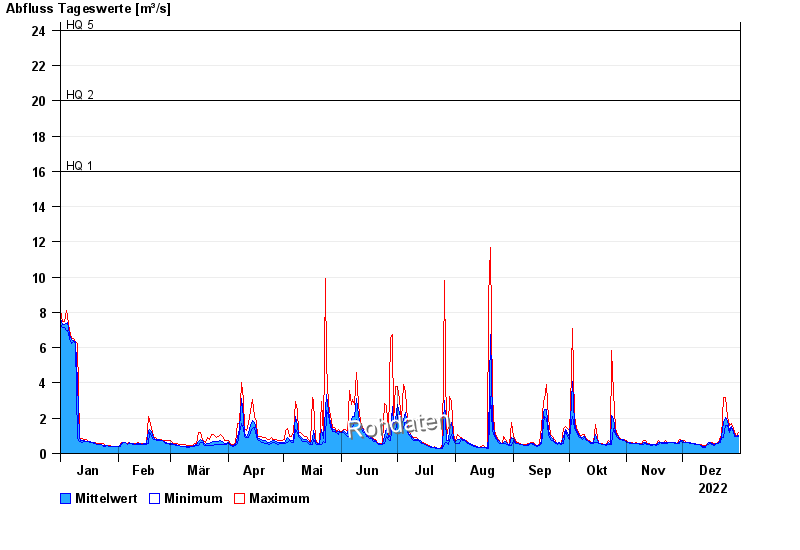
- HQ1 16 m³/s
- HQ2 20 m³/s
- HQ5 24 m³/s
- HQ10 30 m³/s
- HQ20 36 m³/s
- HQ50 44 m³/s
- HQ100 50 m³/s
| Date | Mean value [m³/s] | Maximum [m³/s] | Minimum [m³/s] |
|---|---|---|---|
| 31.12.2022 | 1.03 | 1.17 | 0.977 |
| 30.12.2022 | 0.977 | 0.977 | 0.977 |
| 29.12.2022 | 1.05 | 1.17 | 0.977 |
| 28.12.2022 | 1.23 | 1.39 | 1.17 |
| 27.12.2022 | 1.54 | 1.72 | 1.39 |
| 26.12.2022 | 1.33 | 1.61 | 1.17 |
| 25.12.2022 | 1.85 | 2.07 | 1.61 |
© Bayerisches Landesamt für Umwelt 2024