
- Start >
- Rivers >
- Discharge >
- Iller - Lech - Bodensee >
- Brunnen >
- Chart of year

Chart of year Brunnen / Mühlberger Ach
Discharge from 21.04.2024 to 20.04.2025
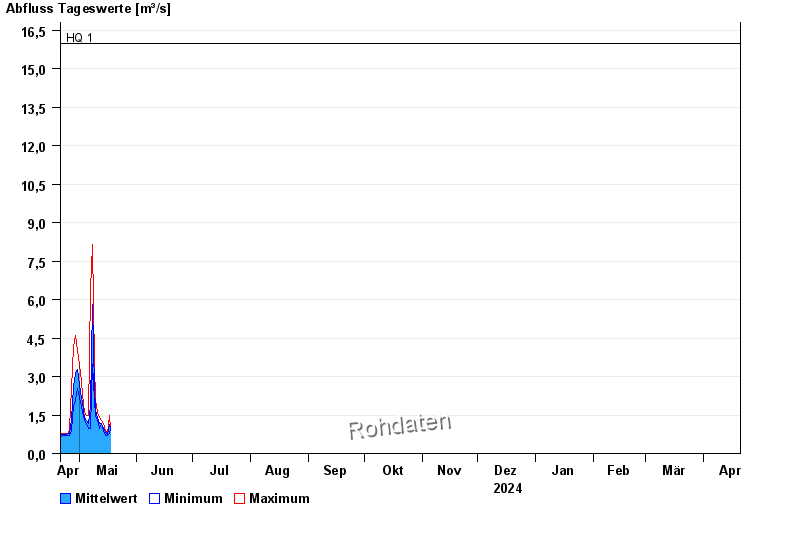
- HQ1 16 m³/s
- HQ2 20 m³/s
- HQ5 24 m³/s
- HQ10 30 m³/s
- HQ20 36 m³/s
- HQ50 44 m³/s
- HQ100 50 m³/s
| Date | Mean value [m³/s] | Maximum [m³/s] | Minimum [m³/s] |
|---|---|---|---|
| 18.05.2024 | 0.974 | 0.974 | 0.974 |
| 17.05.2024 | 1.13 | 1.49 | 0.796 |
| 16.05.2024 | 0.742 | 0.796 | 0.715 |
| 15.05.2024 | 0.823 | 0.88 | 0.715 |
| 14.05.2024 | 0.976 | 1.17 | 0.88 |
| 13.05.2024 | 1.17 | 1.28 | 1.17 |
| 12.05.2024 | 1.16 | 1.39 | 0.974 |
© Bayerisches Landesamt für Umwelt 2024